How Visual Facilitation Techniques Drive Real Innovation
(and Why Sticky Notes Alone Don’t Cut It)
by Peter Durand | Alphachimp LLC, Houston, TX
Why Visual Thinking Matters More Than Ever
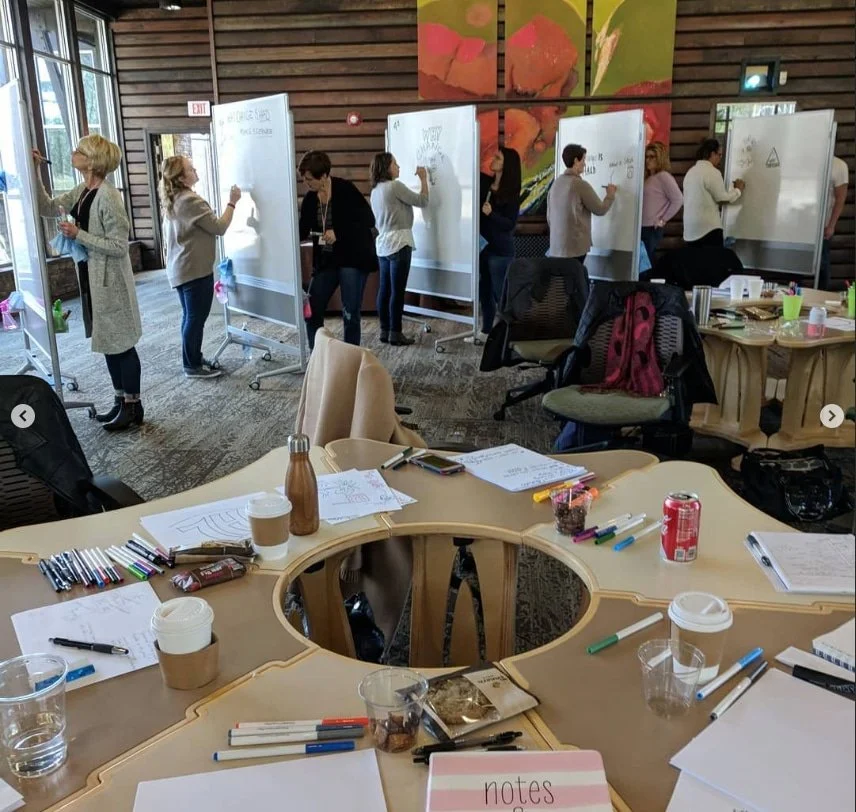
At every innovation workshop I’ve ever run — whether inside a scrappy startup or a global research institution — there’s a moment when the room gets stuck.
The whiteboards are filled. The sticky notes have multiplied. And yet, everyone feels that creeping sense: we’re not actually moving forward.
That’s the moment when visual facilitation stops being decoration and becomes a genuine catalyst for progress.
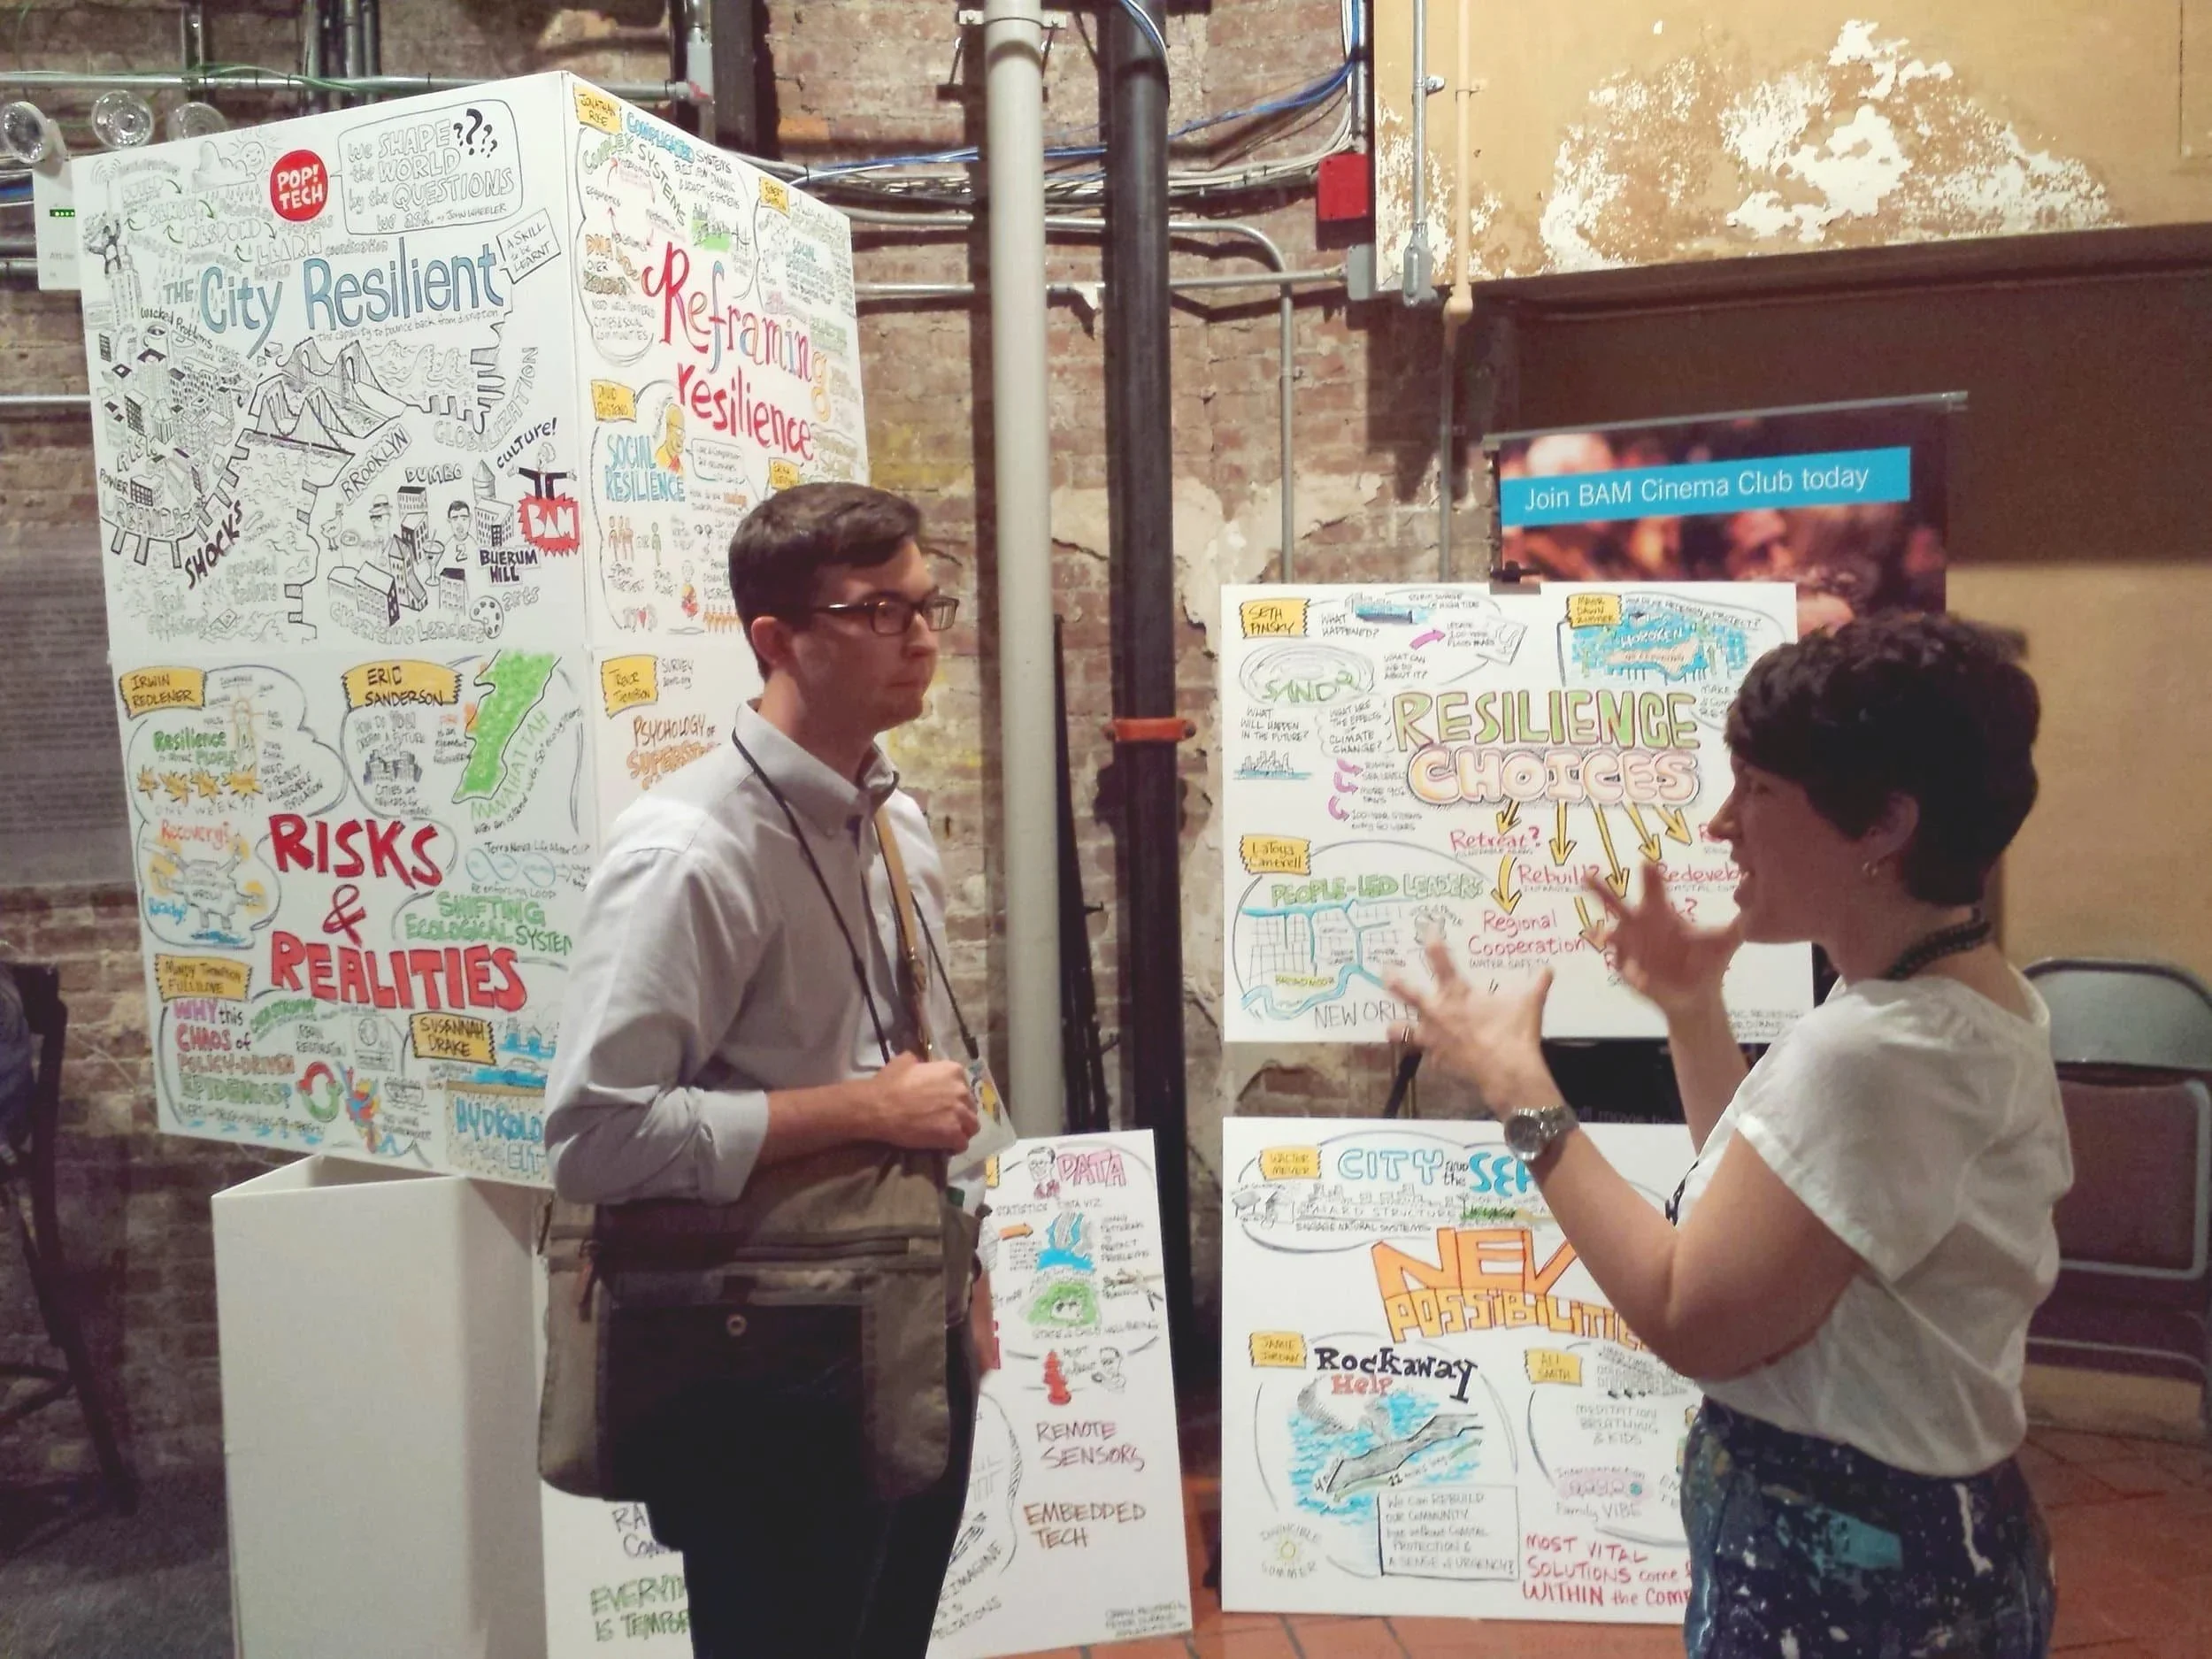
Visual facilitation is more than doodling in meetings. It’s a structured, evidence-backed approach to helping teams see problems, surface ideas, and synthesize insights—visually.
The Jobs Teams Are Trying to Get Done
When organizations call us to lead visual workshops, their goals almost always boil down to three “Jobs to Be Done.”
Functional Job
Make complex ideas understandable.
Align stakeholders across disciplines.
Turn group insights into action.
Emotional Job
Feel confident leading the co-design process.
Reduce meeting frustration.
Avoid wasting time on unclear outcomes.
Social Job
Be seen as a forward-thinking, creative leader.
Model modern, human-centered leadership.
Build a reputation for clarity and collaboration.
So, what’s the pain point?
Traditional facilitation methods rely too much on verbal or linear thinking.
Visual facilitation — through sketchnoting, journey mapping, and digital scribing — helps teams think spatially and relationally, not just sequentially.
Where I first learned the utility of visual learning
Although my university degree was in visual communication (illustration, graphic design, etc.) my first job was in a foreign country teaching English as a second language (ESL).
I was 21 years old and did not have any formal education or training in pedagogy or ESL.
However, I had excellent role models from my own educational journey, specifically “Frau Briggs” our tough but creative German teacher who made every class a new experience. She brought so many different forms of interacting with the “content“ into the classroom: reading, speaking, writing, singing, drawing, sight words, creating stories, creative interpretation, transcribing auditory presentations, interpersonal interaction, storytelling, music, and food.
She addressed all of the various learning styles in the room.
We considered her very demanding. However, I stole every trick and technique once I was at the front of the classroom!
Now I teach these visual learning skills to other teachers and faculty :-)
“Imagination does not become great until human beings, given the courage and strength, use it to create. ”
What the Research Actually Says
Visual facilitation isn’t just “fun”, it’s functional neuroscience in action. Specifically, the skills and ability to create learning environments in which the creativity of others flourishes.
Too often, training and facilitation formats — “sit’n’get” seminars, panel discussions, talking head presentations, bullet point presentations — mirror what has been experienced in the past, rather than relying on research and best practices.
If our goal is to deliver memorable learning experiences and generate new ideas, then understanding how your audience processes information is essential.
Here are some links to basic concepts of visual learning research:
Dual-Coding Theory (Paivio, 1986): People process information more effectively when it’s presented both verbally and visually.
Cognitive Load Theory (Sweller, 1994): Well-designed visuals reduce cognitive overload, allowing participants to focus on problem-solving rather than remembering details.
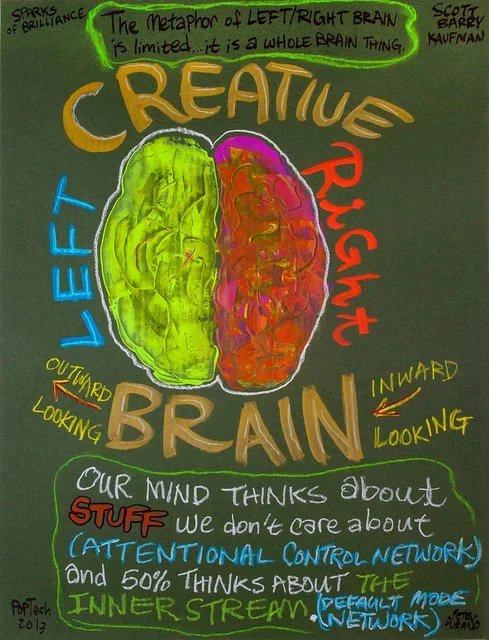
Bloom’s Taxonomy (Anderson & Krathwohl, 2001): Visual methods support higher-order learning — analyzing, evaluating, creating — rather than passive remembering.
Visual Explanations to Improve Learning (Bobek, E., & Tversky, B., 2016). Creating visual explanations improves learning. Cognitive Research: Principles and Implications, 1, 27.
Imagination is the Seed of Creativity (Gotlieb, R.J.M., Hyde, E., Immordino-Yang, M.H., & Kaufman, S.B., 2018): The critical ability to imagine new concepts, products, and worlds in conjunction with other personal factors, such as expertise, personality, and motivation, as well as environmental support.
How Visual Facilitation Sparks Innovation
Visual facilitation works because it creates shared understanding and shared memory.
When people see their ideas drawn out, it becomes possible to connect the dots between disciplines, priorities, and perspectives.
Bloom’s Taxonomy shows us that the skills in the affective domain describe how people react emotionally and their ability to feel the pain or joy of other living things. And emphasizes that this is just as important in learning as the cognitive (or logical) domain of learning, organized in 5 categories: Remember, Understand, Apply, Analyze, Evaluate, and Create.
Knowledge: Recognizing or recalling facts, terms, basic concepts, or answers without necessarily understanding their meaning.
Comprehension: Demonstrating an understanding of facts and ideas by organizing and summarizing information.
Application: Using acquired knowledge to solve problems in new or unfamiliar situations.
Analysis: Breaking down information into parts to understand relationships, motives, or causes.
Synthesis: Building a new whole by combining elements or creating new meaning.
Evaluation: Making judgments about information, based on set criteria or standards.
Affective objectives typically target the awareness and growth in attitudes, emotions, and feelings.
Below are three principles in using visual facilitation to create a group learning experience:
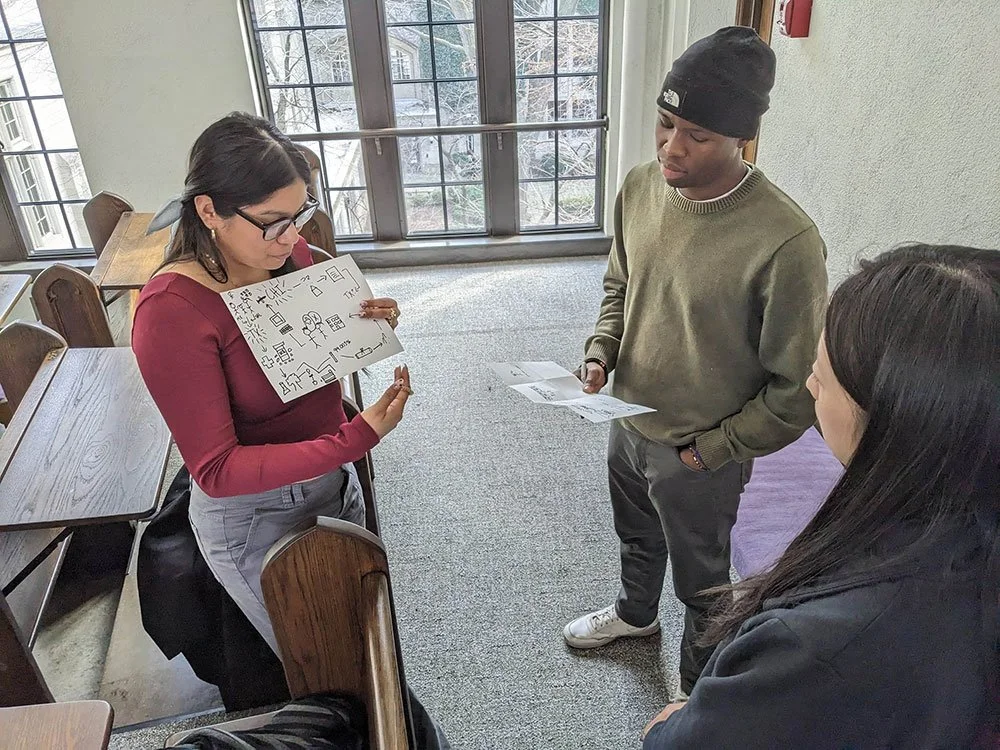
1 : Making the Invisible Visible
When you draw systems, timelines, or user journeys, you externalize thinking. This helps teams identify blind spots that a spreadsheet can’t.
2 : Creating Emotional Resonance
Drawn visuals stick. Research by John Medina found that people retain six times more information from visuals than from text alone. This is crucial in innovation sessions where insights can easily evaporate.
See how visual learning skills can help teachers and trainers →
3 : Building Psychological Safety
When people see their contributions visually represented, they feel heard and validated.
That validation opens the door for creative risk-taking — the real fuel of innovation.
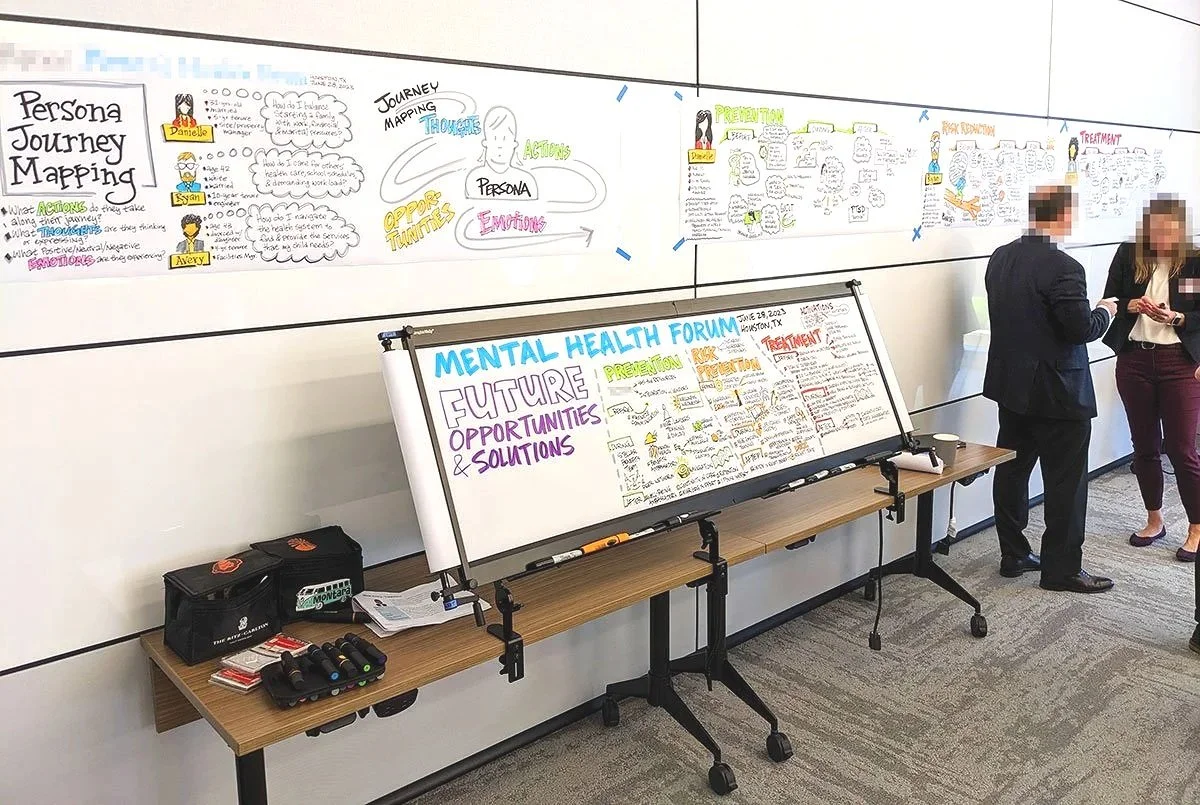
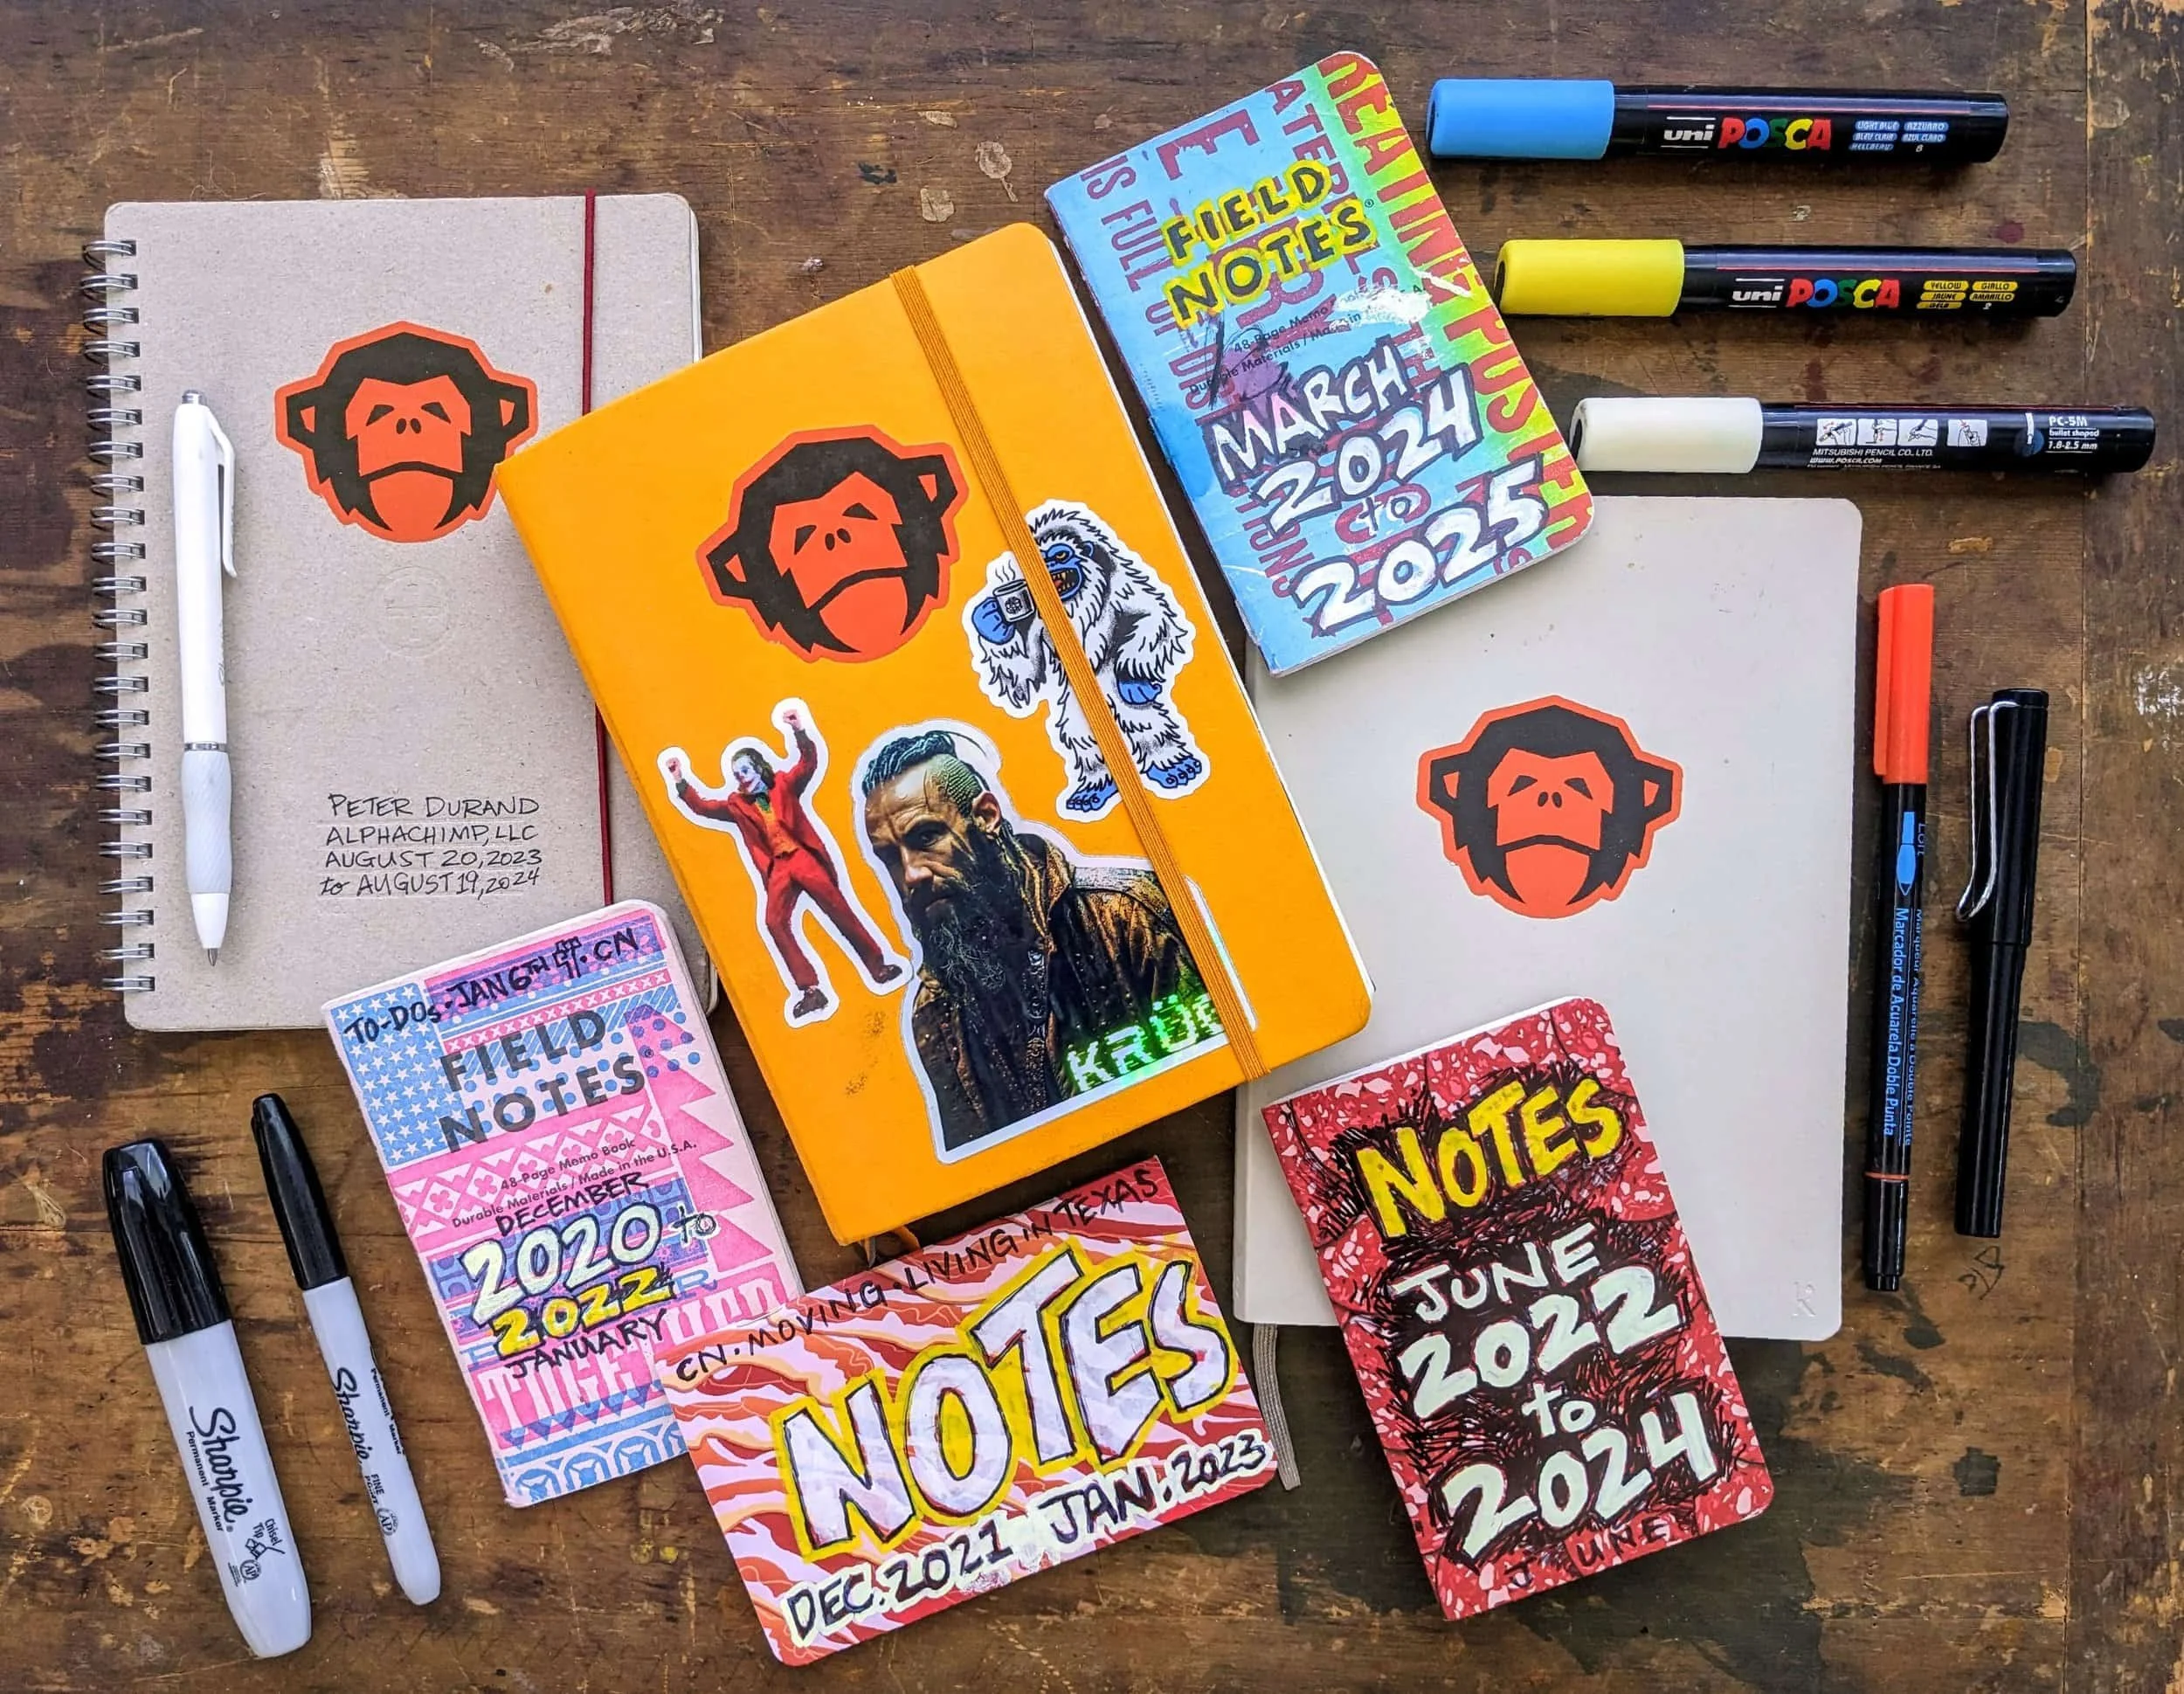
Practical Tools and Techniques

To get started with visual facilitation, you don’t need to be an artist. You need a process.
Here’s the time-tested framework we teach in our workshops, four stages, each with a set of tools and a purpose:
STAGE
TOOL
PURPOSE
Capture
Record conversations in real-time.
Clarify
Identify key themes and relationships in an interaction with participants.
Connect
Show how people, value, and ideas move through systems.
Catalyze
Translate insights and multiple ideas into visual deliverables that communicate at scale.
References
Anderson, L. W., & Krathwohl, D. R. (2001). A taxonomy for learning, teaching, and assessing: A revision of Bloom's Taxonomy of Educational Objectives. Longman.Carney, R. N., & Levin, J. R. (2002). Pictorial illustrations still improve students’ learning from text. Educational Psychology Review, 14(1), 5–26.Kozma, R. (2003). The material features of multiple representations and their cognitive and social affordances for science understanding. Learning and Instruction, 13(2), 205–226.Mayer, R. E. (2005). The Cambridge handbook of multimedia learning. Cambridge University Press.Medina, J. (2008). Brain Rules. Pear Press.Paivio, A. (1986). Mental representations: A dual coding approach. Oxford University Press.Sweller, J. (1994). Cognitive load theory, learning difficulty, and instructional design. Learning and Instruction, 4(4), 295–312.
Ready to Try Visual Facilitation?
If you’re a forward-thinking educator, team leader, or facilitator, now’s the time to introduce visual methods into your workshops.
At Alphachimp, we offer:
Customized visual facilitation workshops for faculty and leadership teams
Live graphic recording for conferences and innovation labs
Train-the-trainer programs for educators and consultants
If you’d like to explore how visual facilitation can help your organization see its ideas more clearly, let’s talk.
Learn more with coaching or training programs.

Meet your instructor:
Peter Durand
Adjunct Professor: Northwestern University Pritzker School of Law, Chicago, USA
Trained Facilitator: MG Taylor DesignShop™ Methodology & The Artist’s Way at Work Coaching
Professional Coaching Certificate: Vanderbilt University Owen Graduate School of Management, Nashville, USA
Masters Degree in Industrial Design: Jan Matejko Academy of Fine Arts, Krakow, Poland
Bachelors Degree in Fine Arts & Visual Communication
Washington University in St. Louis, USA