Journey Mapping & Timelines: pathways for storytelling
From our online course, Become a Rockstar Scribe at School or Work.
Benefits & Applications Across Industries

These tools enable richer qualitative insights, facilitate participant engagement, and make quantitative findings more accessible and actionable.
Areas such as healthcare research continue to adopt human-centered design, and leveraging visual methods can lead to more impactful, patient-centered outcomes.
By adopting these approaches, researchers can ensure that their work informs policy, improves clinical practice, and ultimately enhances patient care.
What is the difference between graphic recording and creating a collaborative journey map or timeline?
Journey maps are a crucial component of the design thinking process.
They visually represent a user’s path toward completing a goal.
They serve as a tool for identifying opportunities for improvement, highlighting areas where user experience can be enhanced, and ultimately leading to the creation of better products and services.
Timelines are helpful for a group to record its history—or that of a specific industry or domain—as we plan for an unpredictable future.
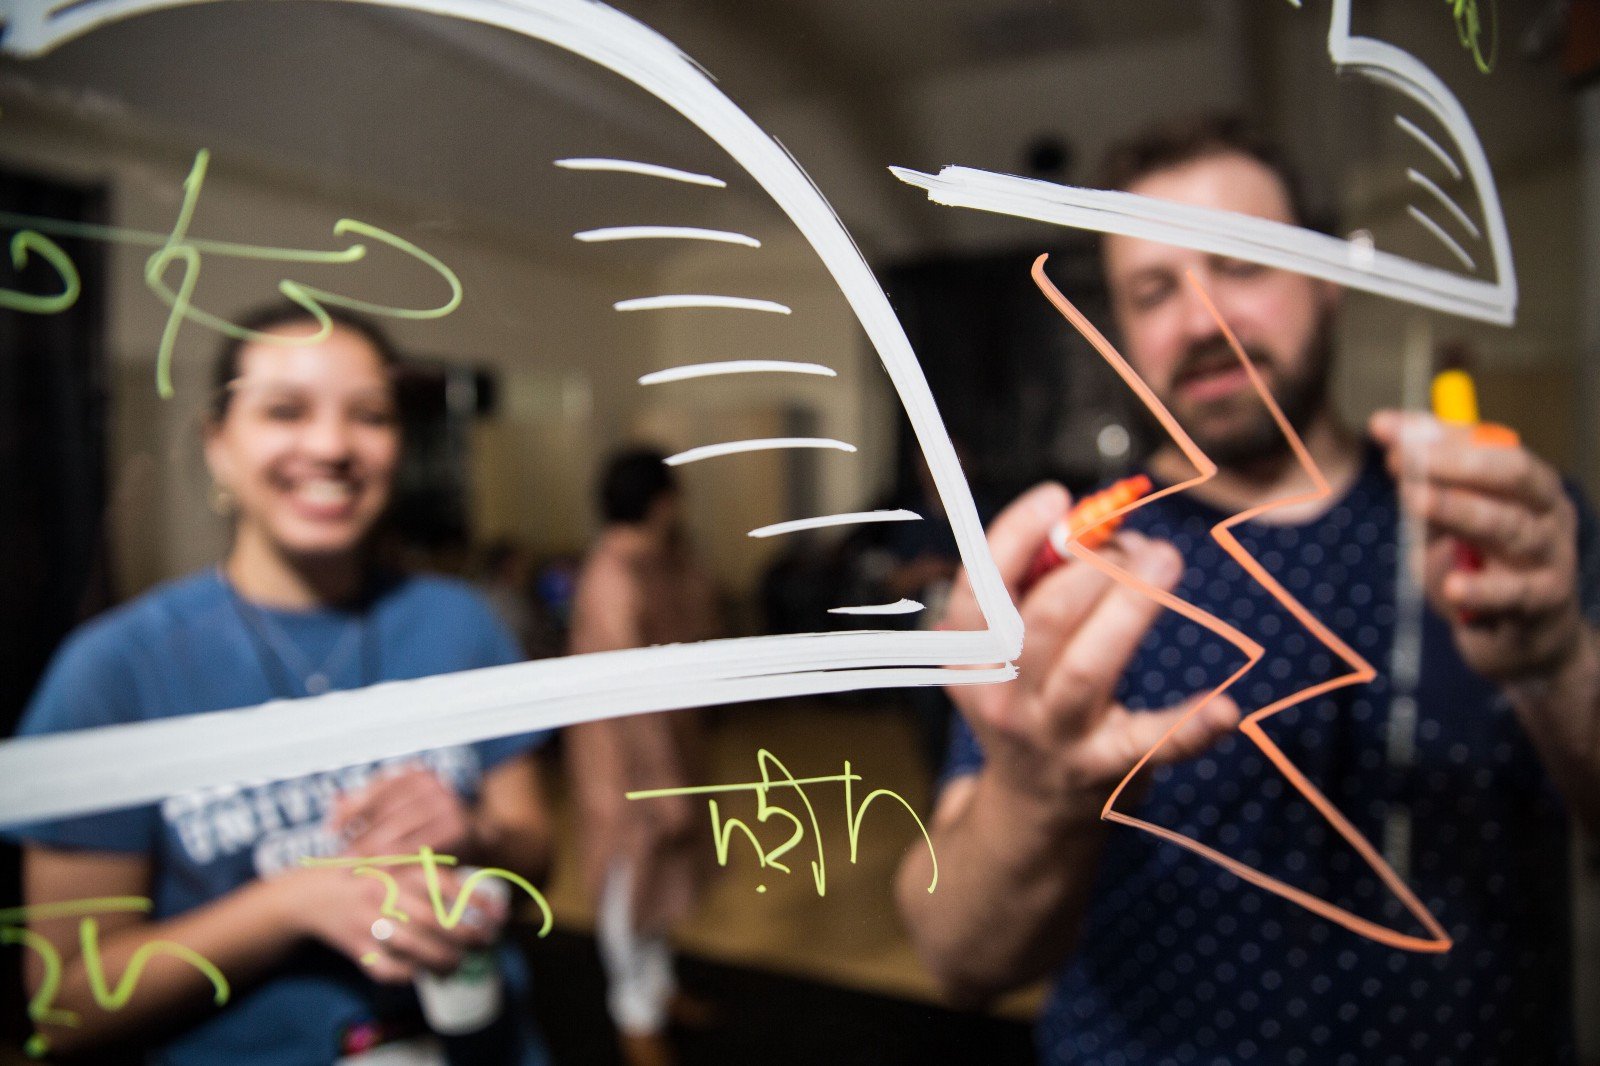
This collaborative process, which requires both preparation and spontaneity, is a team effort.
These can be created LIVE onsite or iteratively over time, with each team member contributing their unique perspective.
Integrating visual explainers and illustrated journey maps into research enhances both data collection and communication.
How We Create Them
(Live vs Iterative)
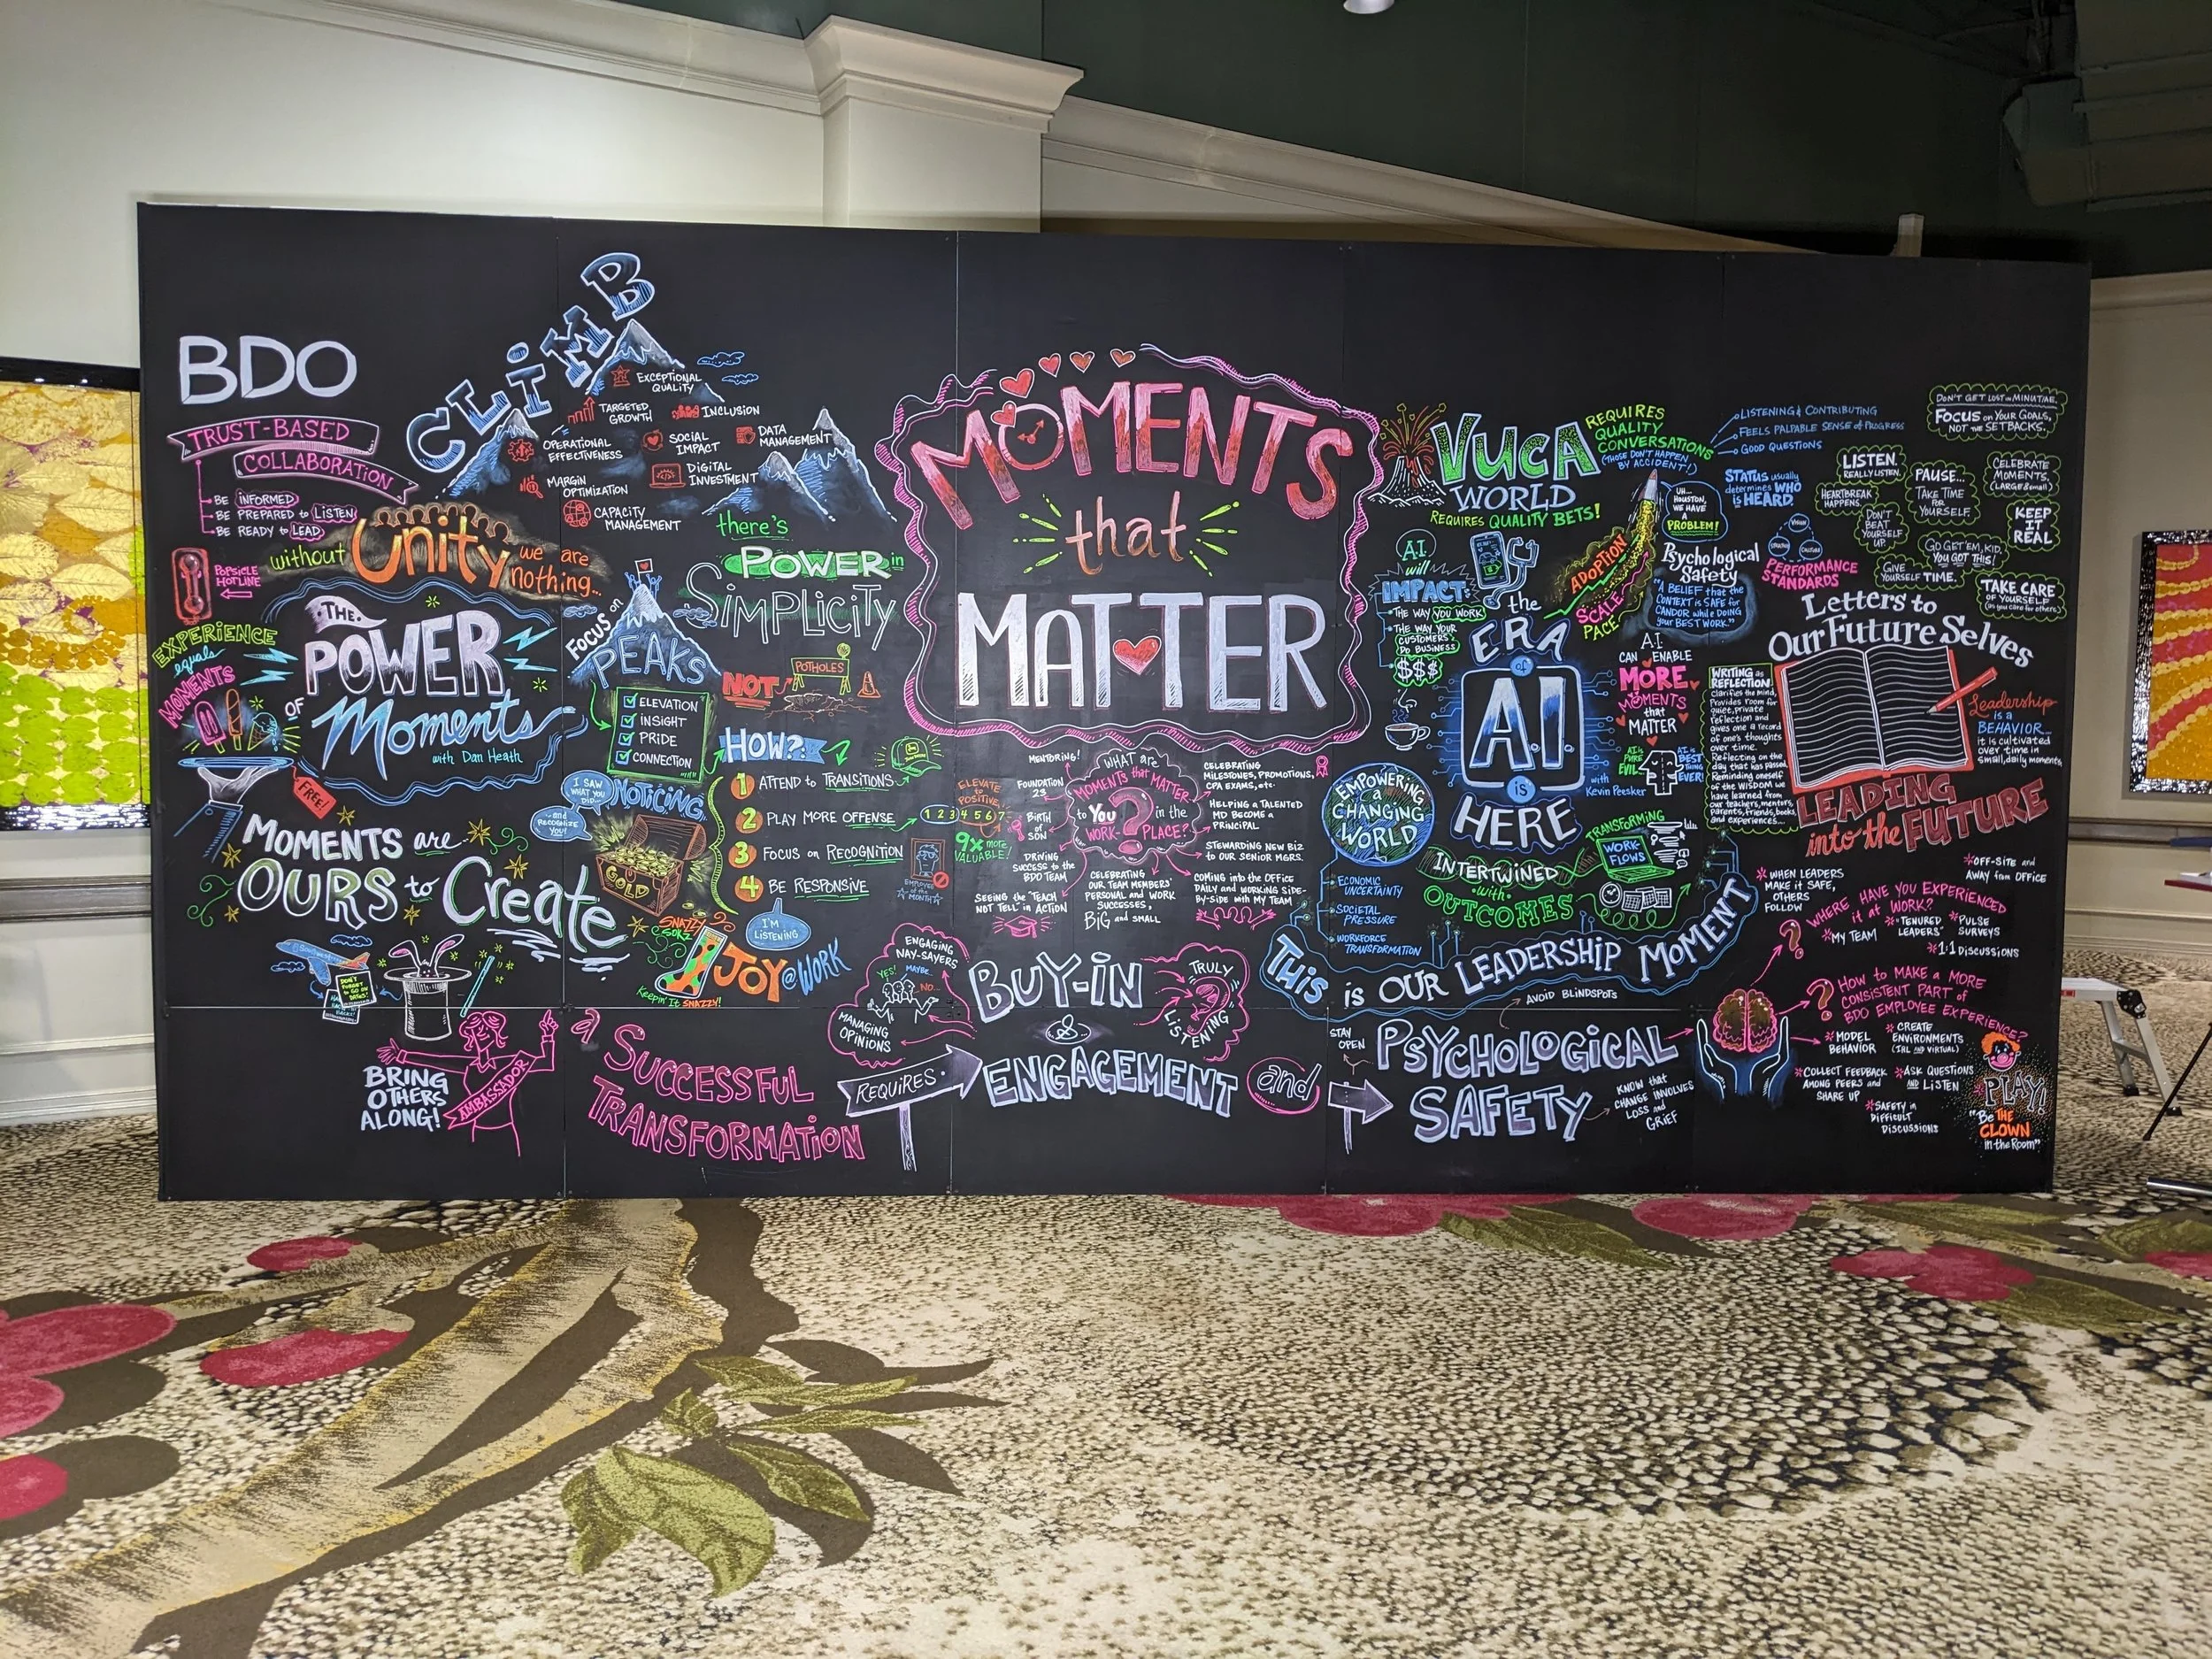
Case Study #1
Onsite Workshops with Post-Event Journey Maps
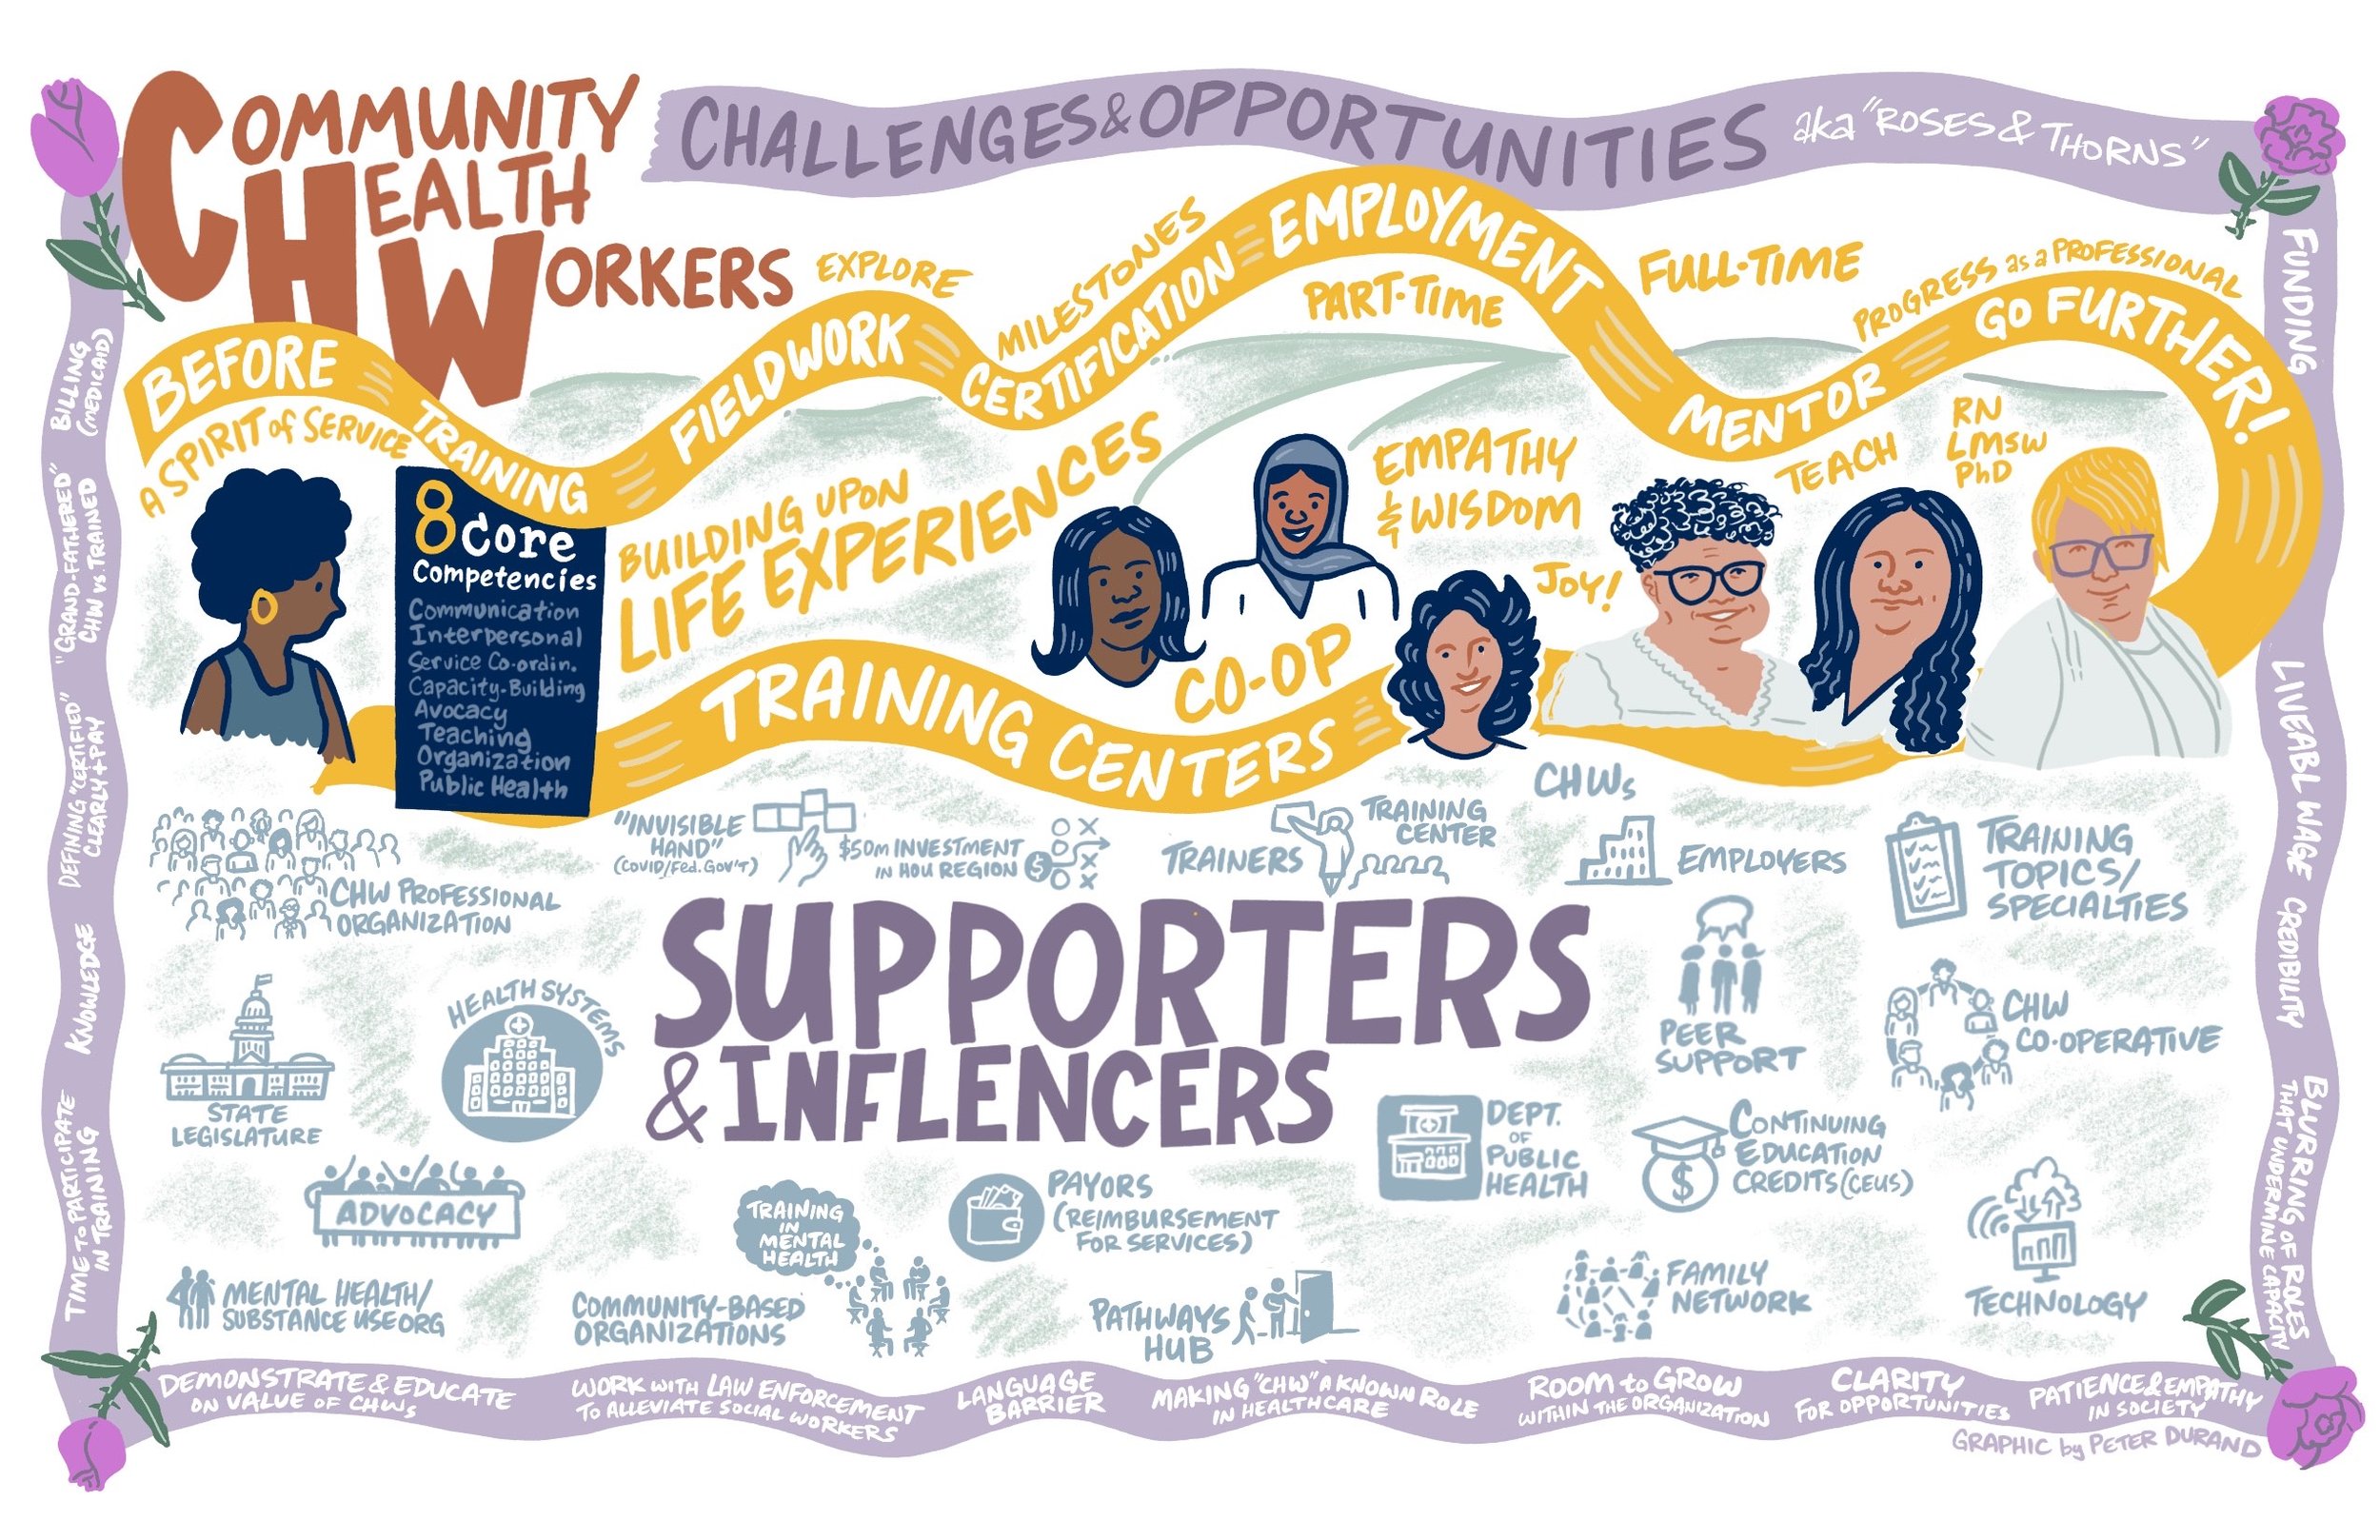
We worked with the Health Equity Collective in Houston, Texas, over several months and workshops to create a journey map for community health workers.

Raw output from breakout sessions or entire workshops can be synthesized, iterated, and refined to produce a holistic map or timeline.
Case Study #2
An Animated Timeline
From antiquity through the Enlightenment, the practice of physicians creating formal documentation for patient visits is a relatively recent development in medicine.
This is a brief history of patient records, narrated by Dr. Kevin B. Johnson, former Cornelius Vanderbilt Professor & Chair of the Department of Biomedical Informatics at Vanderbilt University Medical Center in Nashville, Tennessee.
Past Projects
-
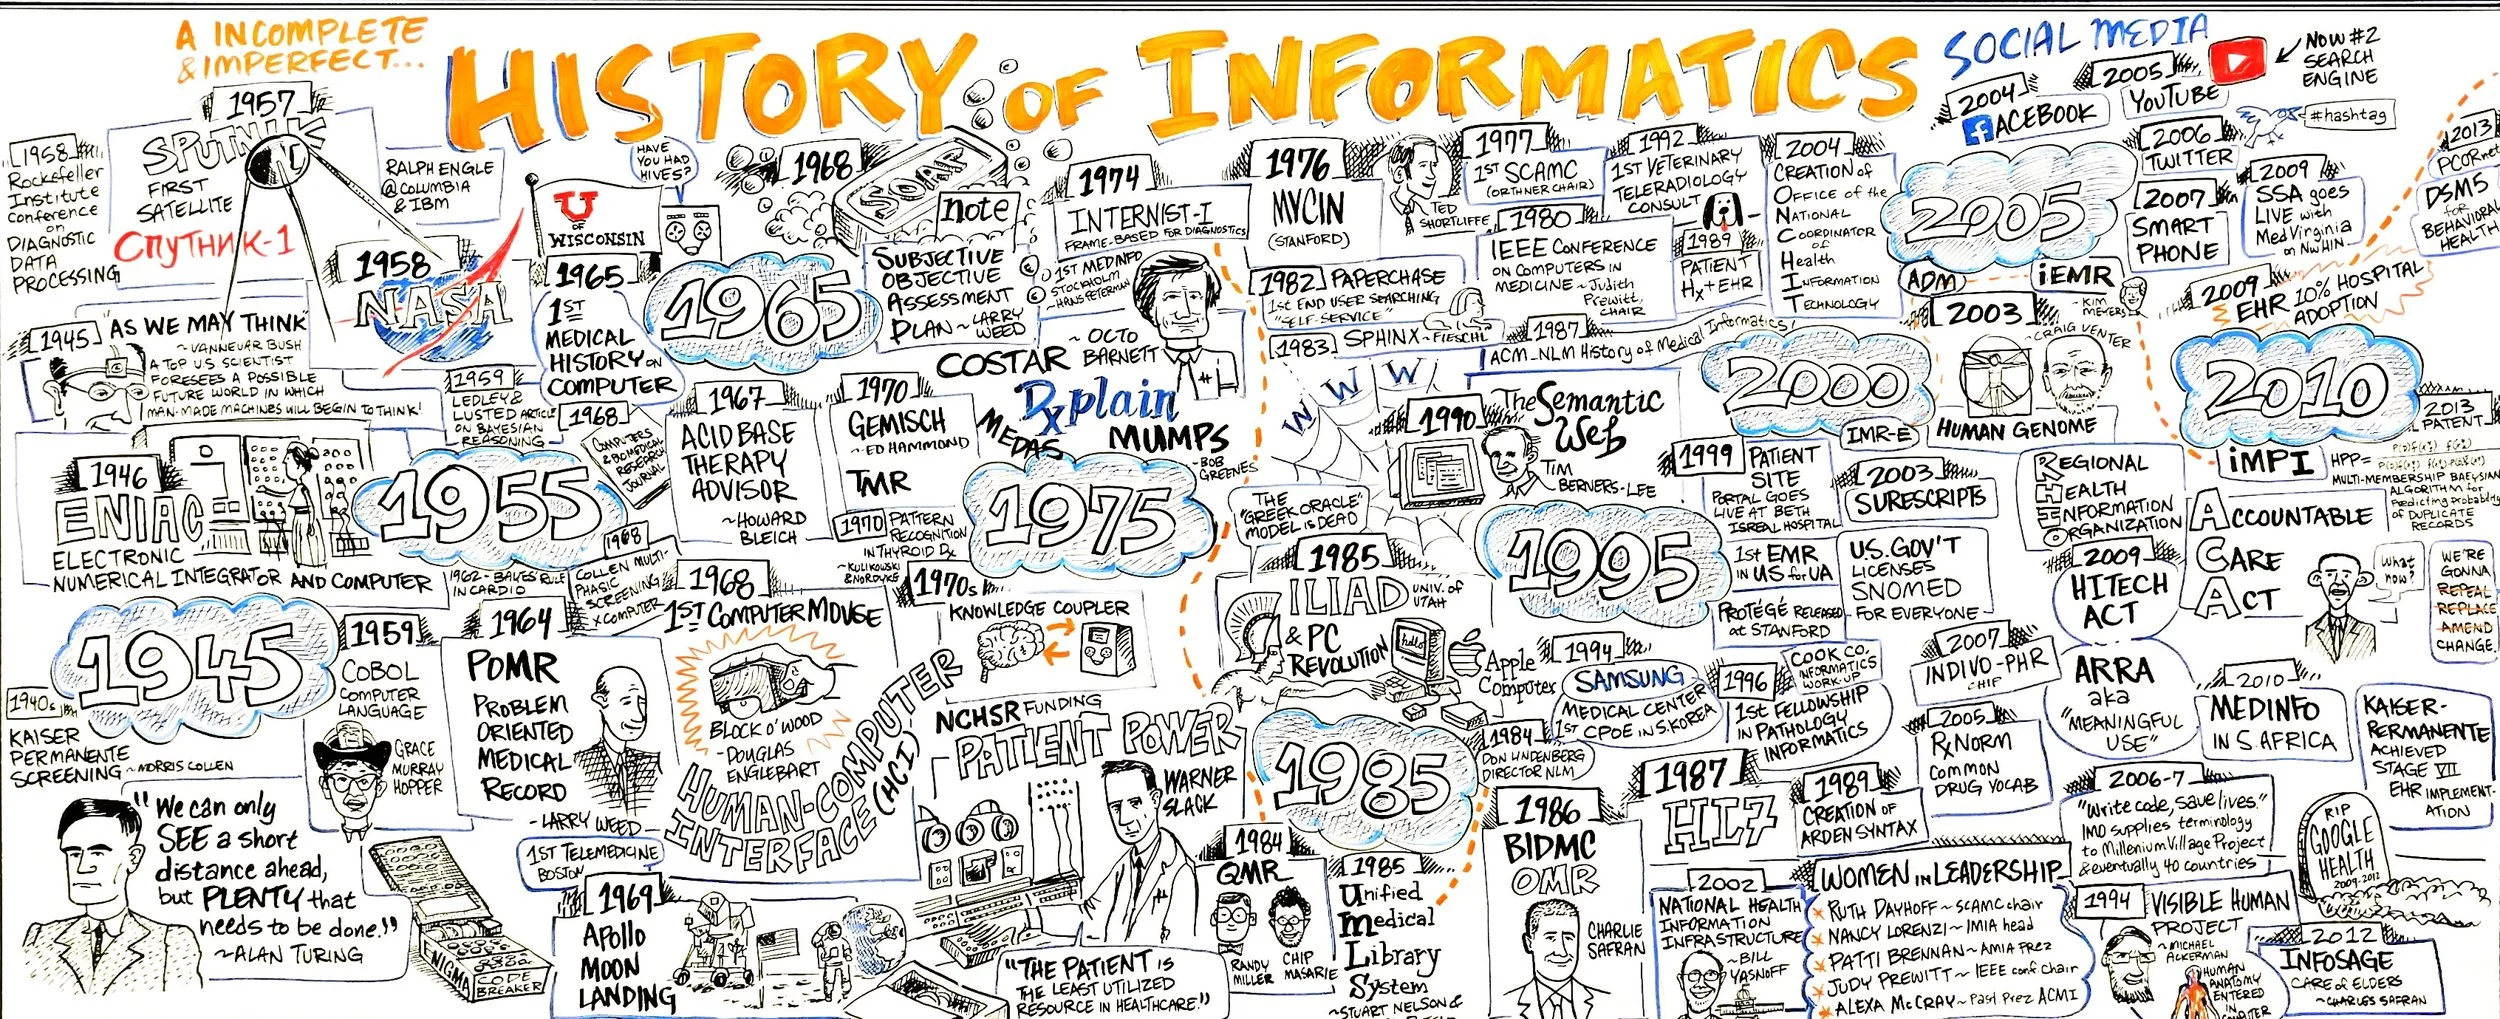
![A detailed infographic depicting the history of informatics, including key milestones from 1945 to 2012, with illustrations, dates, and descriptions of technological advances such as the first satellite, the first medical computer, the development of the internet, social media emergence, and modern healthcare technologies.]()
History of Informatics
-
![Illustration of community health workers and supporters with text highlighting their training, employment, mentorship, and support roles in healthcare. Features images of diverse people, a building, and various training and health-related icons.]()
Community Health Worker Journey Map
-
![This is a timeline infographic illustrating the 2020-2021 Early Career Leadership program by National Geographic. It includes key events, themes, and activities such as orientation in August 2020, community leadership in April 2021, and graduation in September 2021, with focus on public speaking, negotiation, mentorship, and decision-making.]()
NatGeo Early Career Leadership Timeline
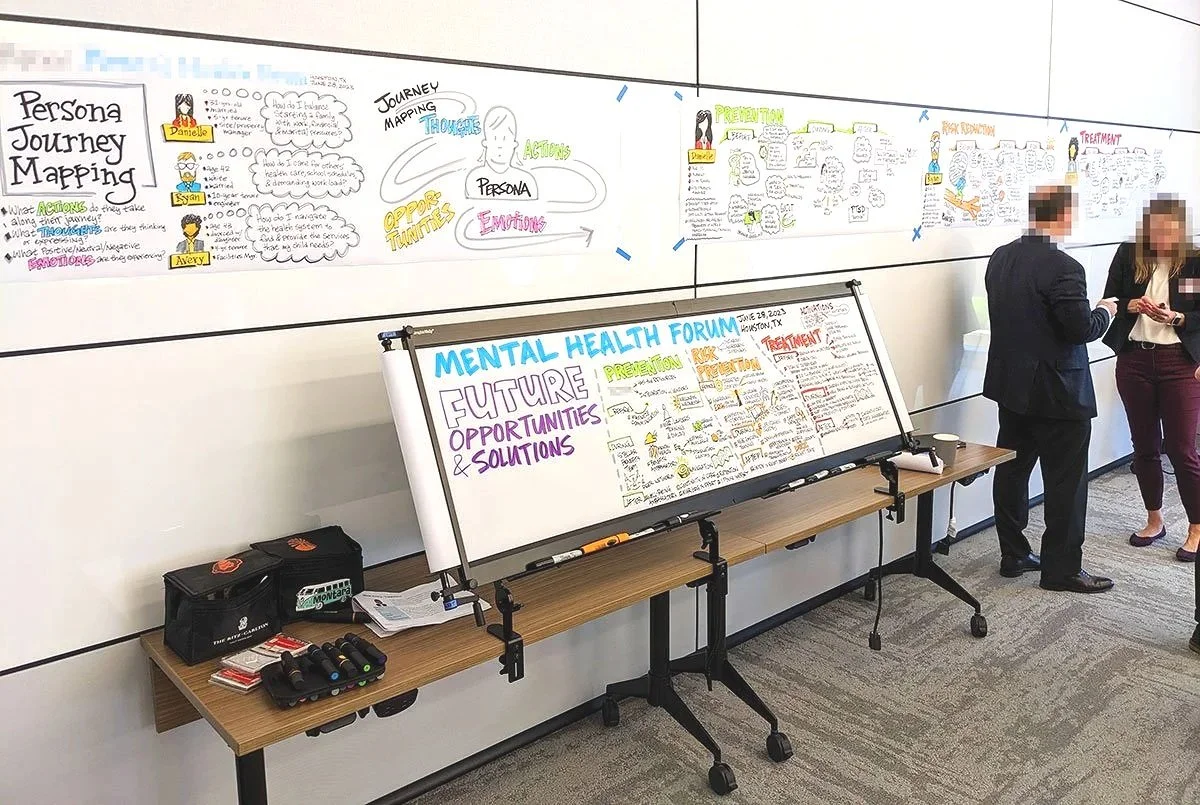
-
![Graphic recording illustrations with colorful notes and diagrams for a mental health forum titled 'Future Opportunities & Solutions,' with two people in business attire conversing nearby.]()
Mental Health Journey Map
-
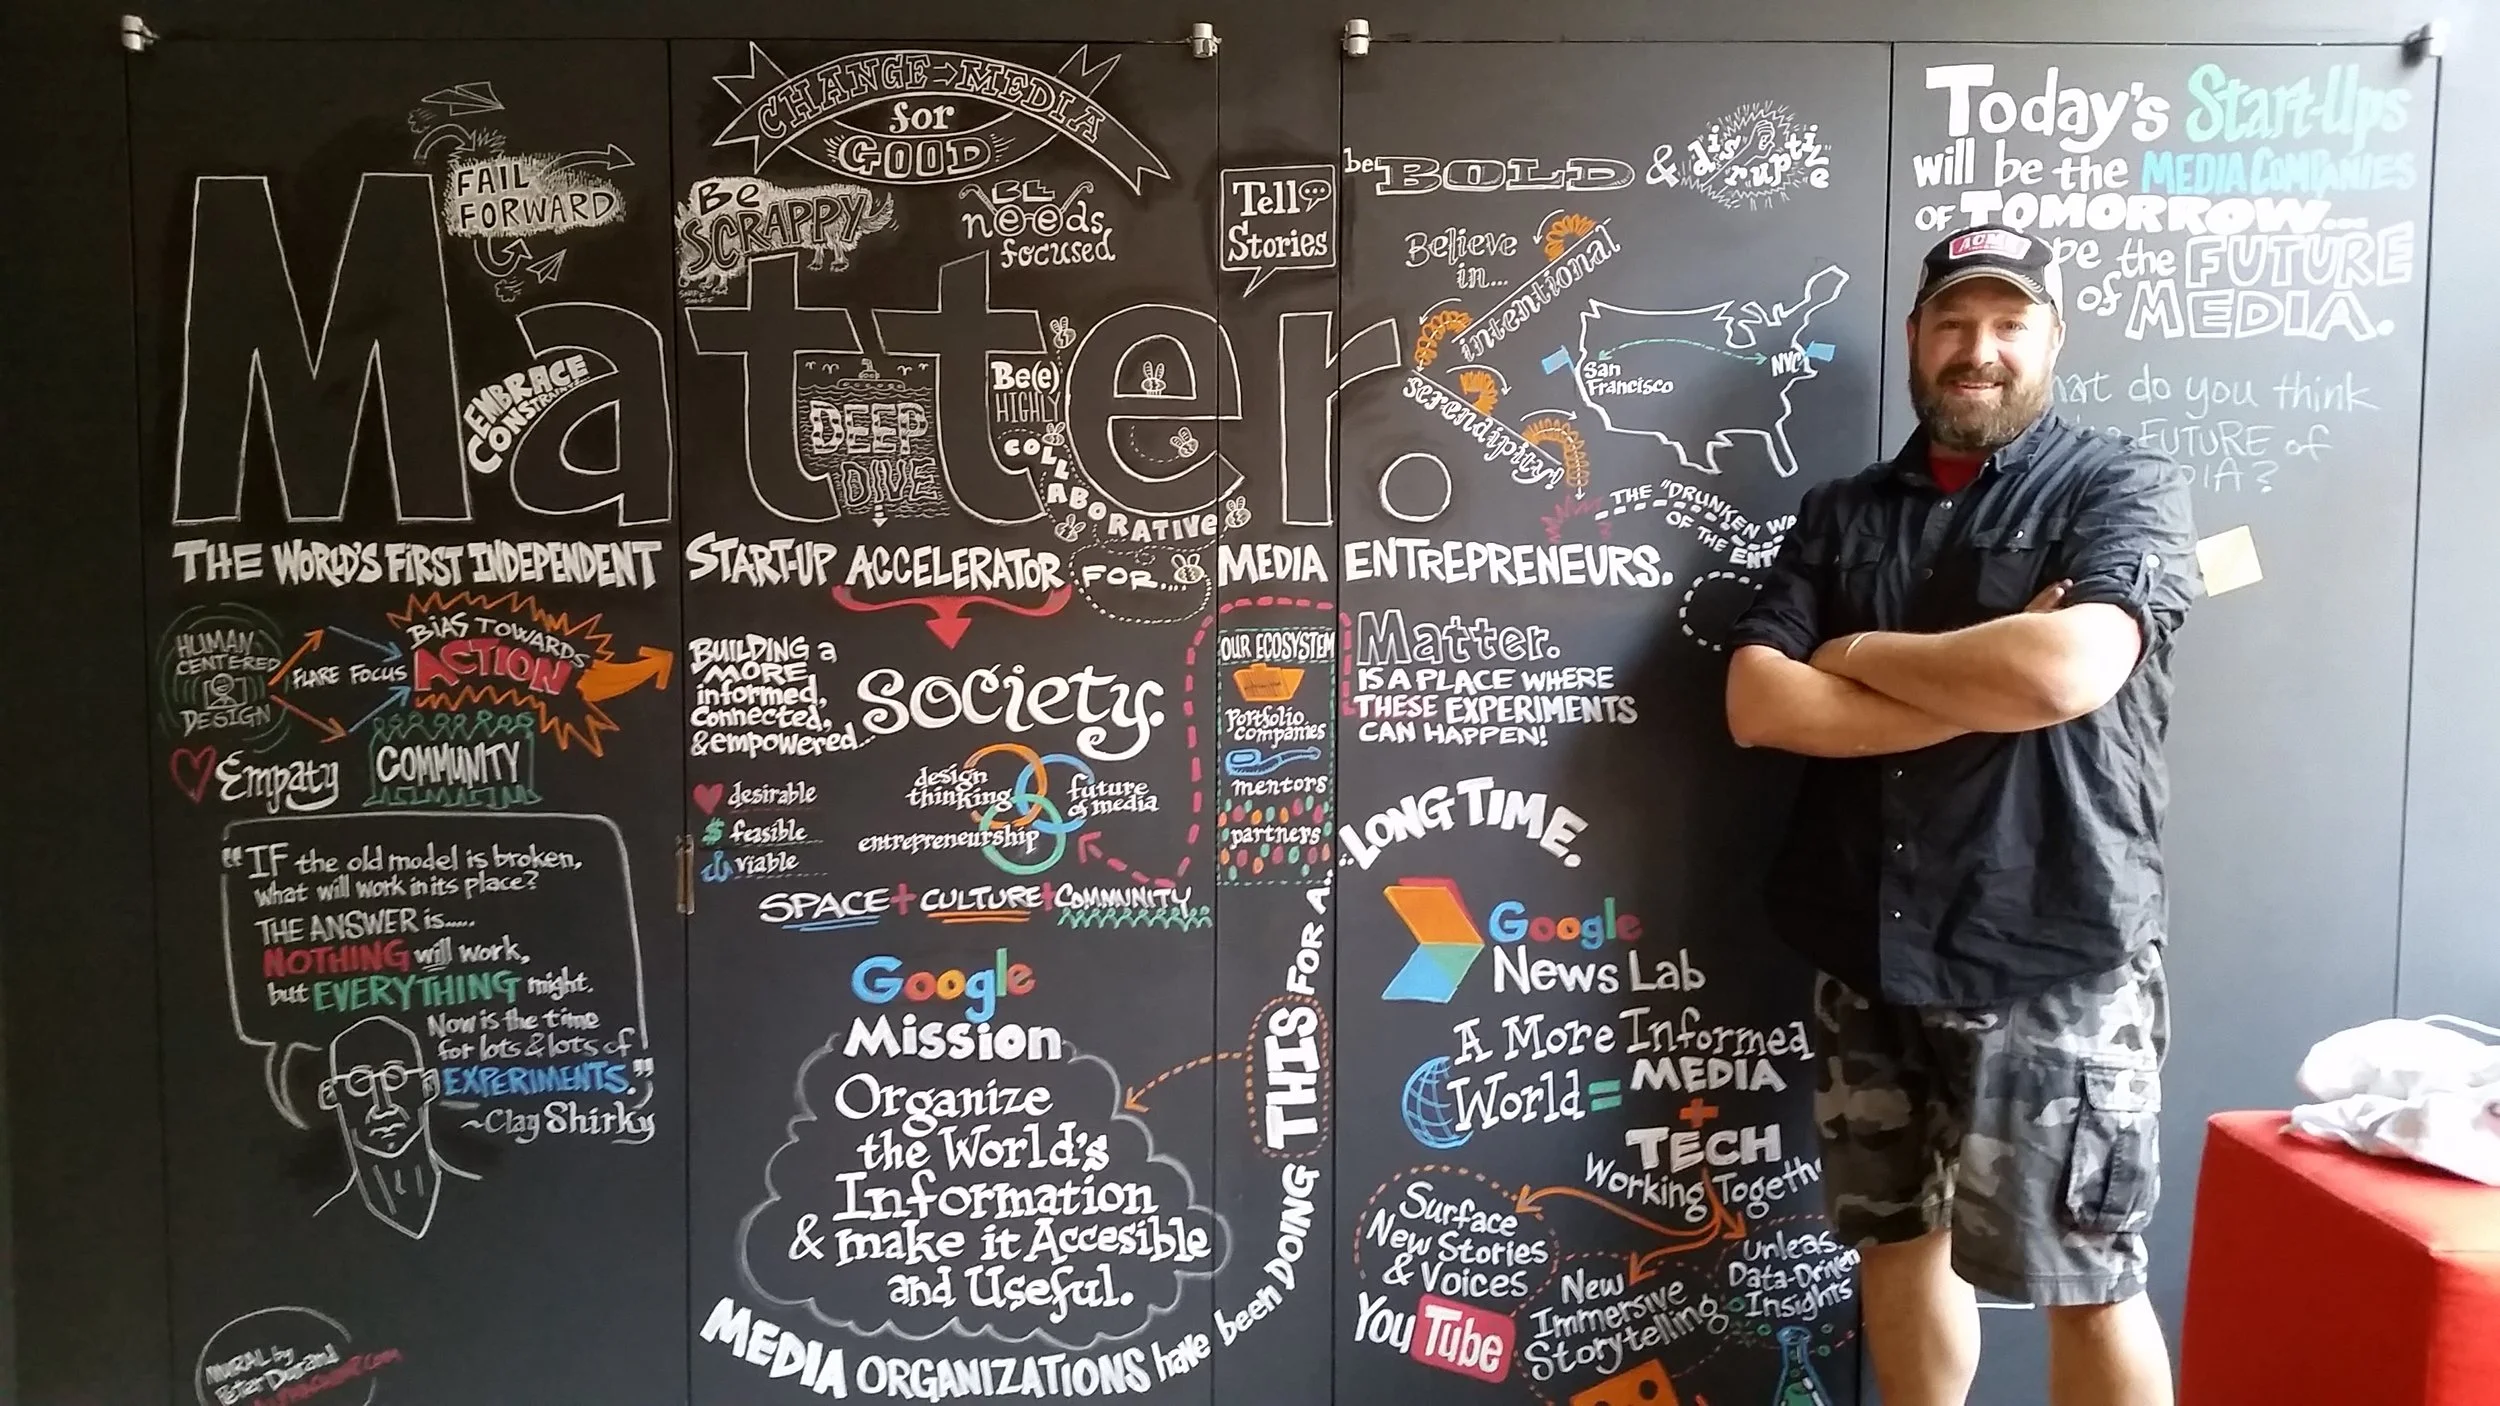
![Peter Durand is standing with arms crossed in front of a blackboard filled with colorful handwritten notes about media, society, and startups, including phrases like "Organize the World’s Information," "Google News Lab," and "Future of Media."]()
Accelerator timeline
-
![Colorful chalkboard with notes about healthcare technology, big data, AI, blockchain, and medical innovations. Includes headings like 'IMOO20', 'Personalized Medicine', 'Big Data', and 'Future' with various keywords and diagrams.]()
The History of Medical Records


Get in Touch!
Feel free to drop us a line and let us know how we can help you understand complex situations and make better decisions.
Each project is a little different. We work with our clients and partners to craft something that fits their business needs or social goals.
Send a quick message, SCHEDULE A CALL or create a detailed PROJECT REQUEST.
Follow the action!