Graphic Recording & Live Illustration Services
We blend active listening skills, design, and narrative to create real-time visual summaries of ideas during in meetings and workshops.

Graphic Recording works. Why? Because Humans are hard-wired for visual learning!
Every mark we make as a graphic recorder — also known as a visual note-taker or live illustrator — is designed to increase engagement and understanding for your audience.
During live meetings and conferences, both in-person and online, this captures your big ideas and visualize complex concepts to help people make better decisions.
Want us to rock the markers at your next meeting or conference?
Still have questions? Scroll down for more :-)
A Visual Practice
A Brief Note: Since you are here, you most likely have a sense of what this is, but here is how we describe it. Feel free to use this if it helps you explain to your clients or colleagues. You can also download a PDF of our portfolio to view a variety of photos and work samples here.
Also known as graphic note-taking, this is an effective tool for audience engagement.
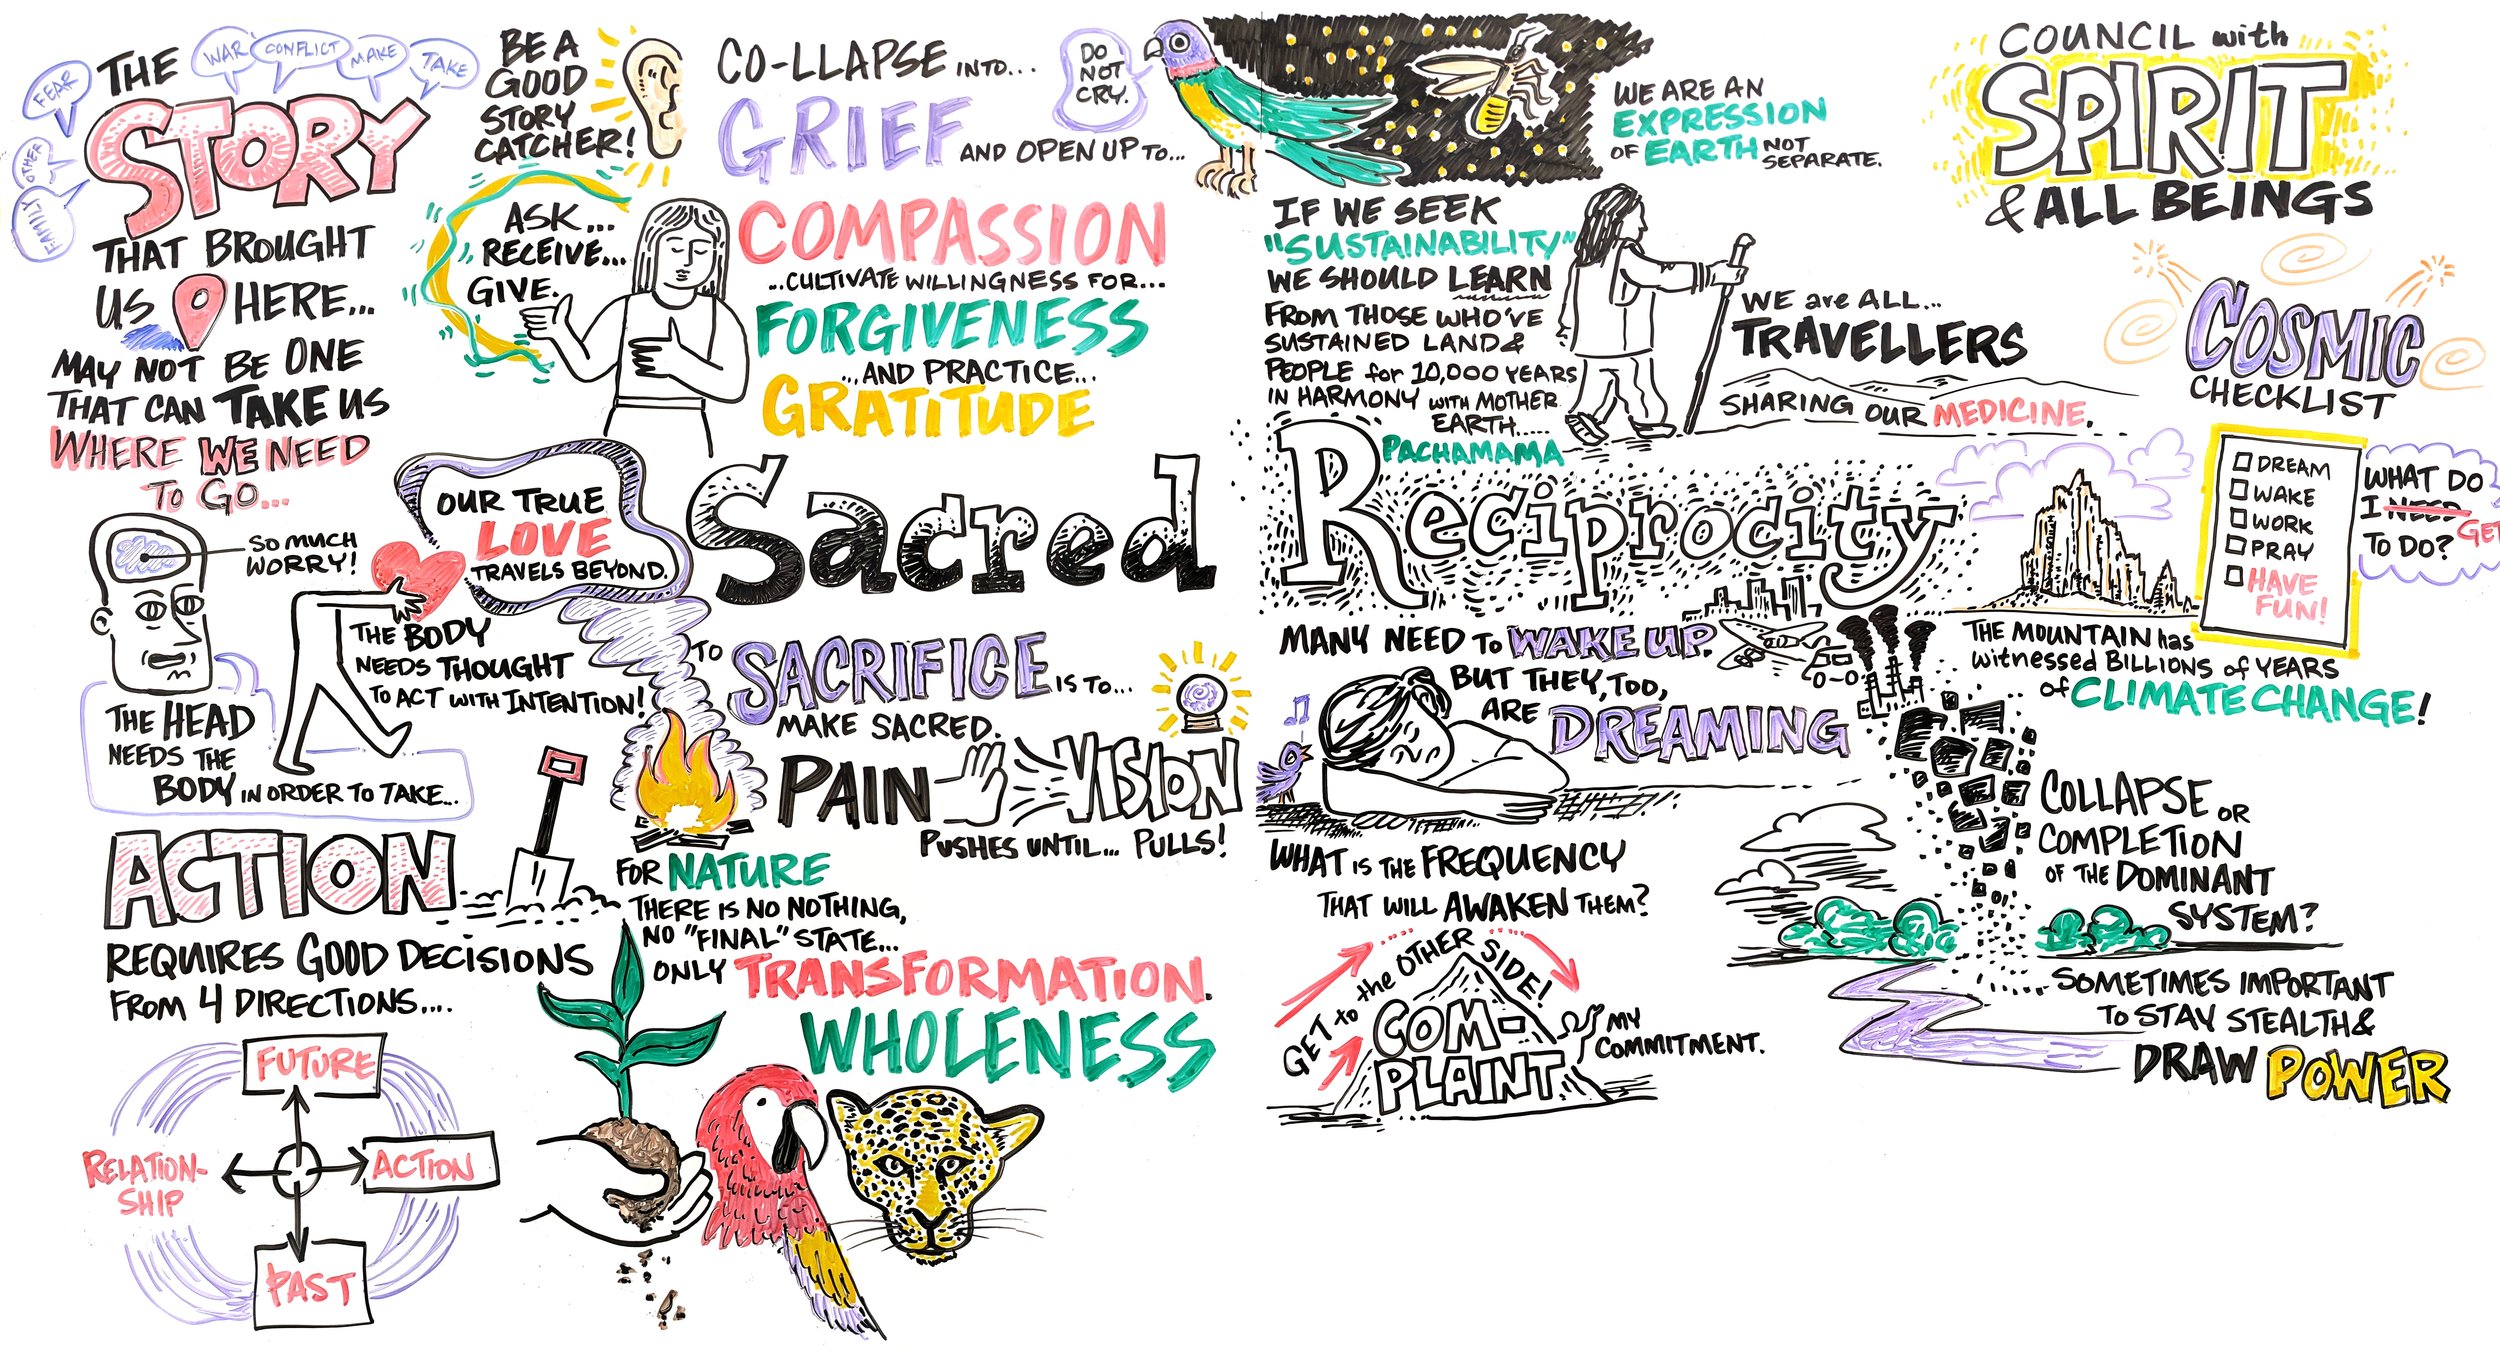
The creation of words and images during live events captures and communicates ideas and stories.
It blends active listening skills, design, and narrative to create real-time visual summaries of ideas shared in meetings and workshops.
Also known as “visual note taking“, this practice uses a mix of diagrams, symbols, and text to capture group dialogue, creating a visual summary.
The resulting visual summaries enable audiences to understand complexity and to make better decisions.
Why Visual Summaries Work
In plain terms, graphic note-taking and visual summaries:
Reduce cognitive load—visuals + words = stronger memory.
Build shared understanding—everyone sees ideas emerge together.
Spark creativity—visual thinking makes connections feel like “aha” moments.
Consider adding a citation from dual-coding research to ground it.
Cognitive psychology research suggests that the brain processes information through two distinct, but connected, systems:
A verbal system for language and stories
An imagery system for visual information
This visual practice also serves as an effective tool with several functions:
Creates a conceptual map of a conversation.
Connects data and information to emotion.
Visualizes complex or abstract concepts.
Aids memory and retention of stories, facts, and connections.
Guides individuals and groups through a process.
This is due to our brain’s ability (and desire!) to receive information through both words and pictures.
Dual Coding Theory suggests that by presenting information in both words and pictures — or by encouraging learners to create mental images — the brain creates two separate memory codes that are interconnected, leading to more effective encoding, better understanding, and improved long-term retention.
Who Benefits?
Our “typical“ client is a leader looking to engage their audience more fully and produce visual tools to aid with retention of information and clarity of implementation.
We’ve worked with Fortune 500 companies, universities, nonprofits, and startups — anyone who needs to turn complex ideas into clear, visual stories that connect people to ideas.
From personal experience as learners, artists, designers, and facilitators, we have seen consistent and remarkable benefits from graphic note-taking.
We have seen the practice used by:
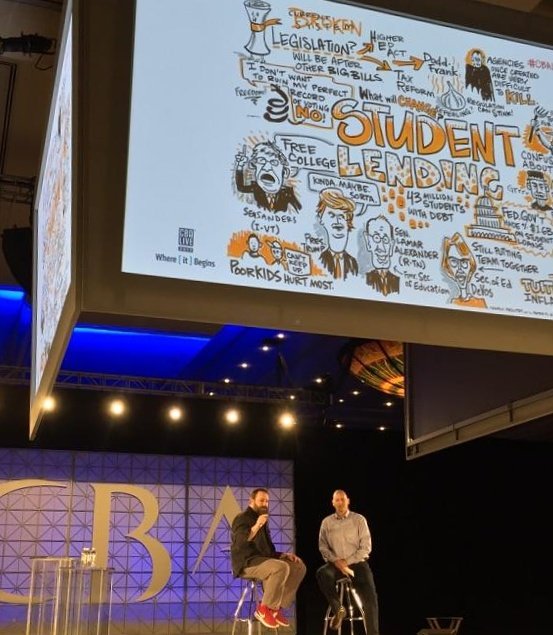
Conference speakers
Strategy facilitators
Educators & academic leaders
Innovation teams in remote, hybrid, or in-person formats
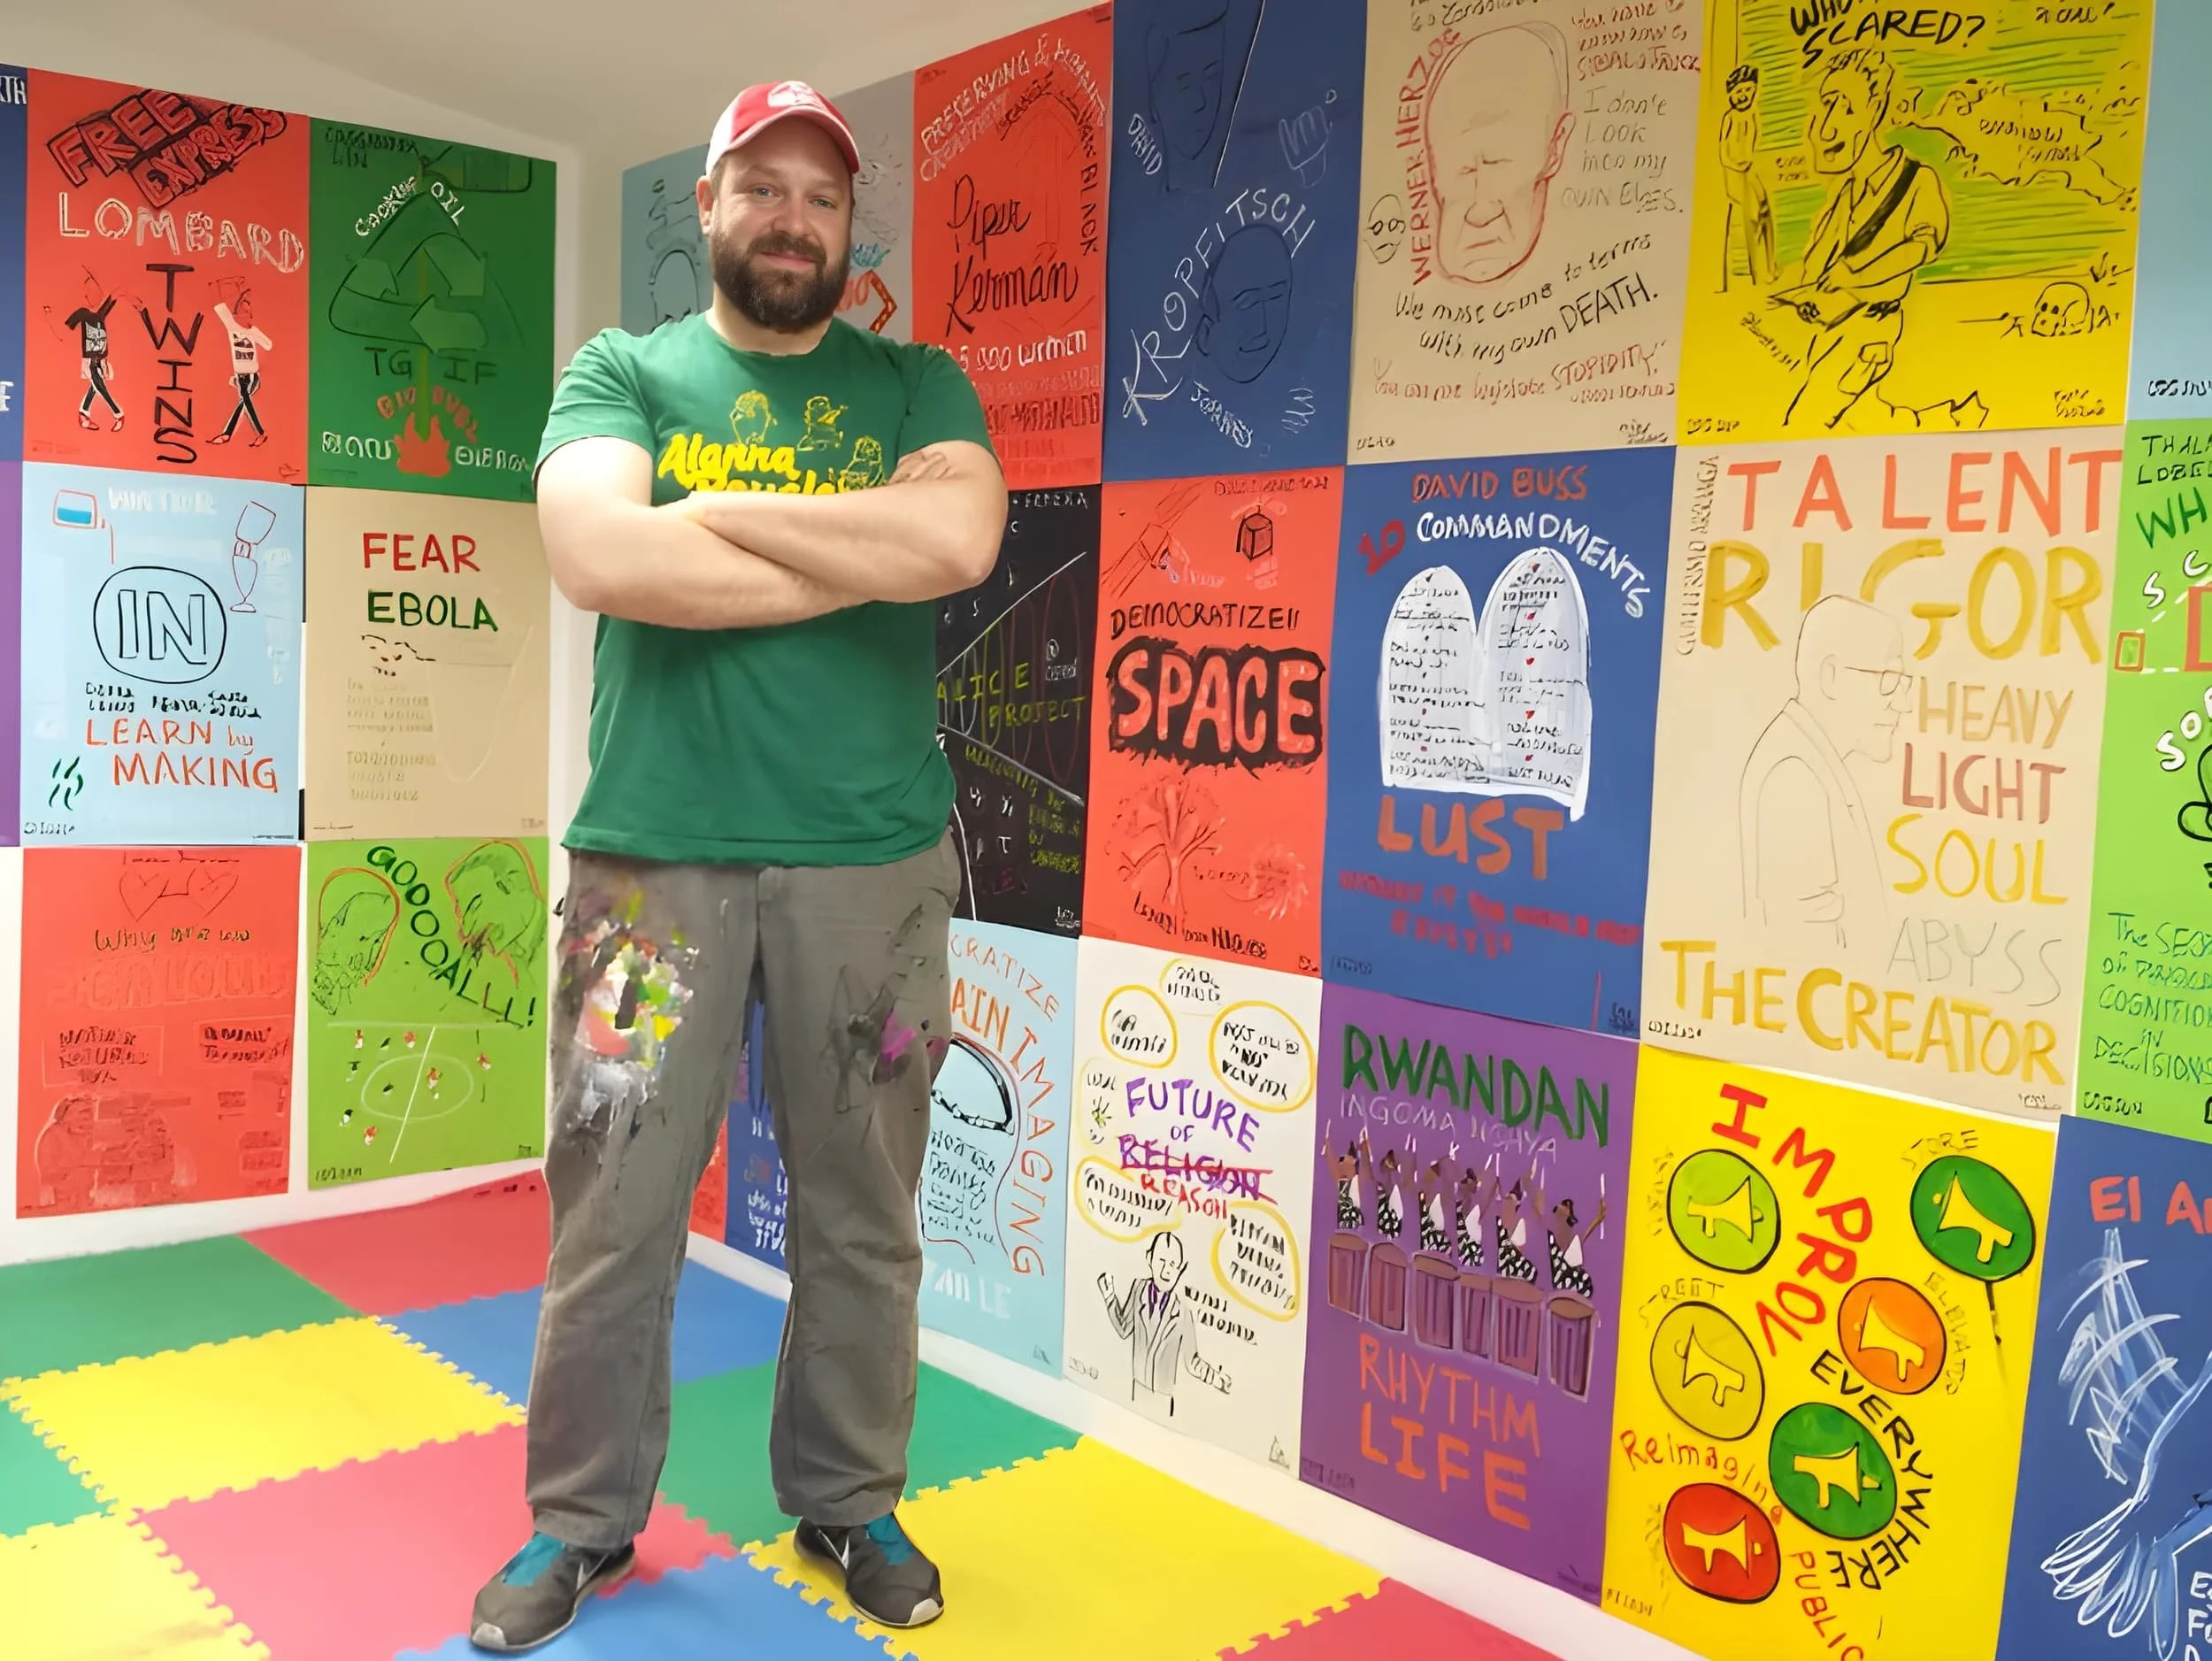
Since its founding in 1998, Alphachimp has provided this service for hundreds of intimate brainstorming sessions and high-profile conferences, including those for Facebook, Google, TEDx, TEDMED, Ciudad de las Ideas, PopTech, and many industry and association conferences.
How much does it cost?
Pricing varies significantly depending on event length, travel, the number of recorders, and deliverables.
Material and travel costs are influenced by whether the event is physical or virtual, as well as whether you request a physical or digital graphic note-taking.
We offer flat-rate packages for workshops, conferences, and explainer videos.
For onsite events, the Alphachimp day rate per artist begins at $2500, depending upon the scope and scale of the engagement.
Virtual events start at $1,250 for a minimum of half a day, including prep and post-production.
We also offer discounted services for educational and nonprofit groups, and for multiple engagements.
CONTACT US for a tailored quote.
NOTE: If we are unable to assist you due to scheduling, geography, or budget constraints, we will do our best to connect you with a qualified member of our global network.
How It Works
We meet with your team once or twice to clarify goals, agenda, and key messages. This ensures the visuals align with your brand identity and desired outcomes and will help participants achieve clarity.
Walk through your process with rhythm and short sentences:
Before the Event: We chat. Sketch goals, tone, and your event story.
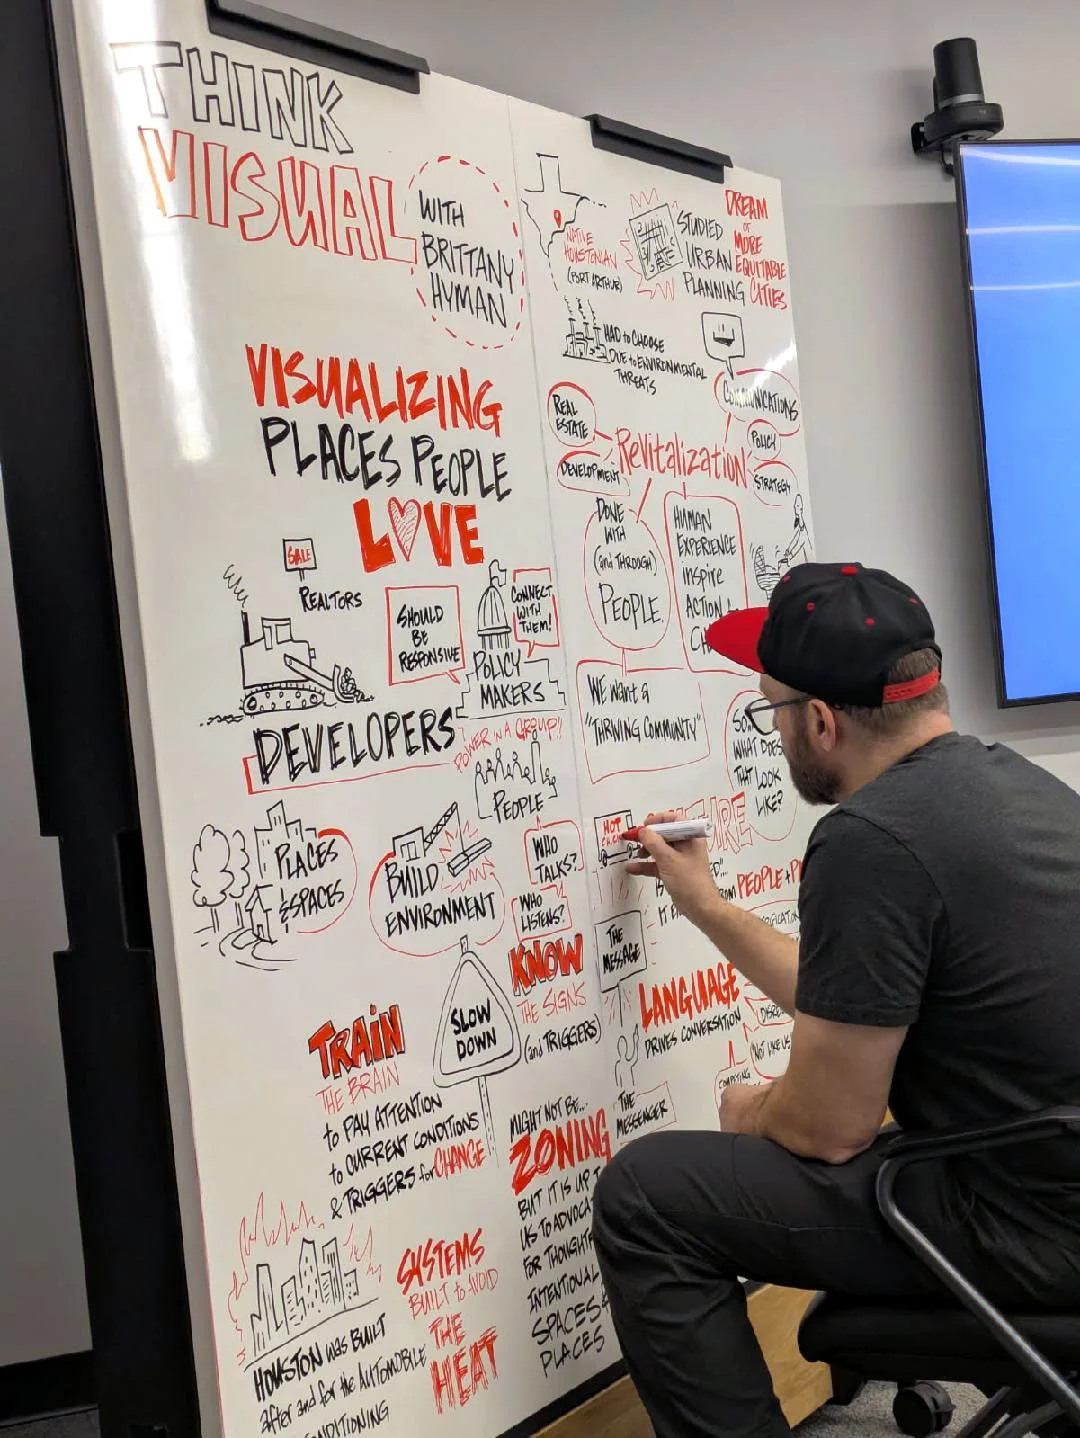
During the Event: We draw in real time—on boards, iPad, or screen share.
After the Event: You get the polished visuals—easy to share & keep.
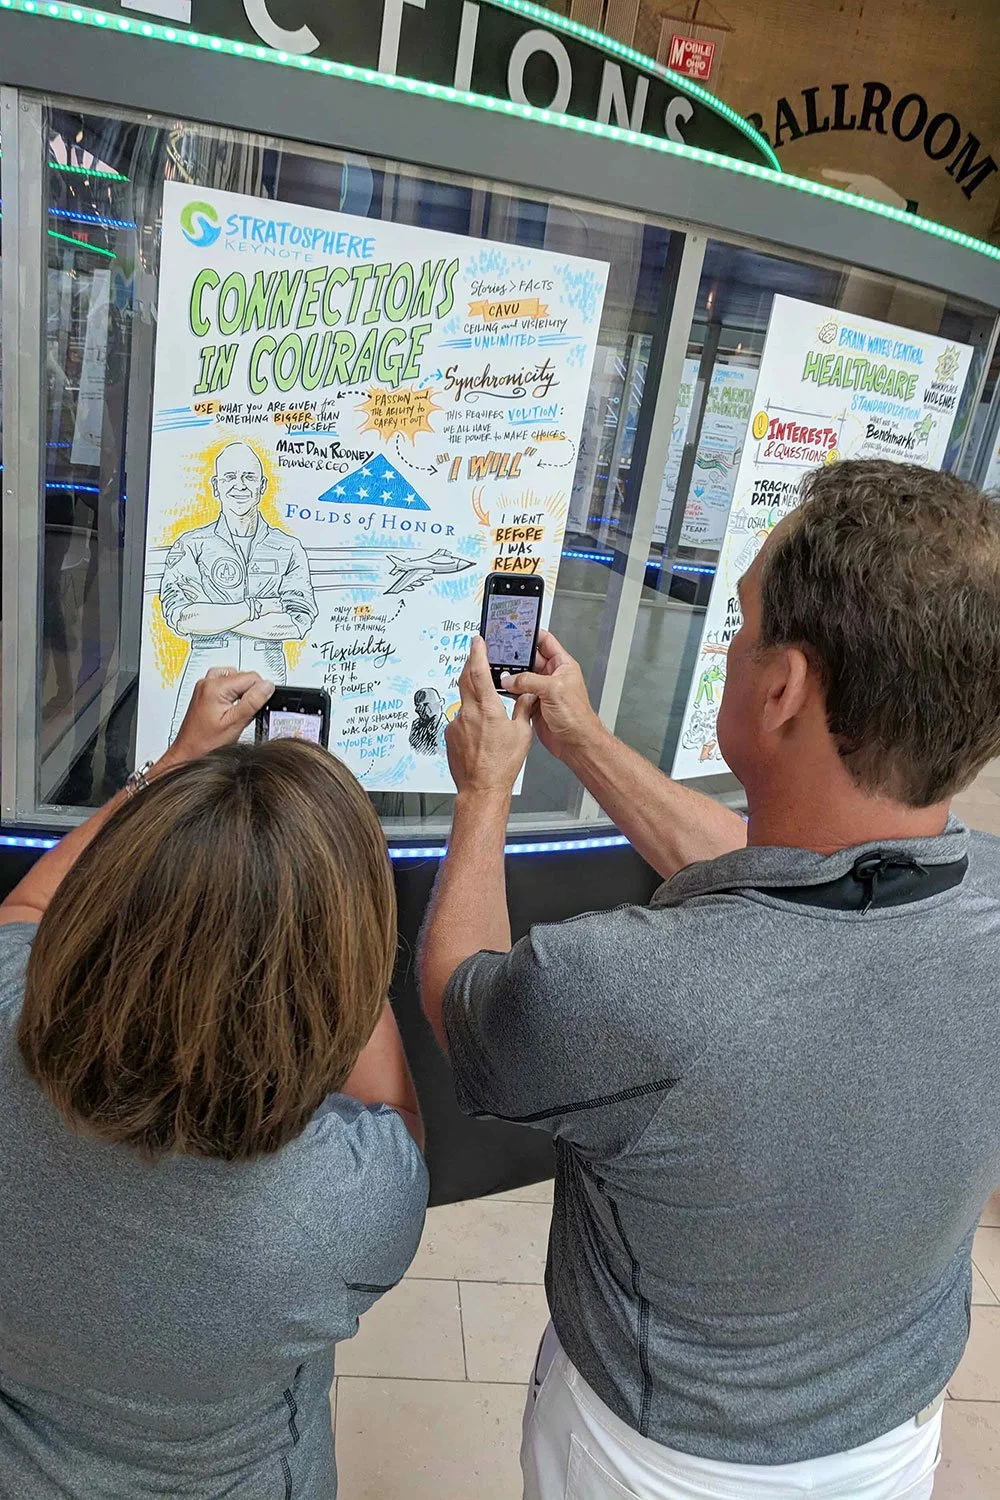
You will receive high-resolution digital images of the visuals, ready for reports, social media, training, or newsletters.
For in-person sessions on boards or paper, you can also keep the original artwork. Our fee also includes usage rights.
What’s the difference between a graphic recorder, a visual facilitator, and a visual note-taker?
Yup! There are lots of different terms used in different contexts for this visual way of working. Here is how we break it down:
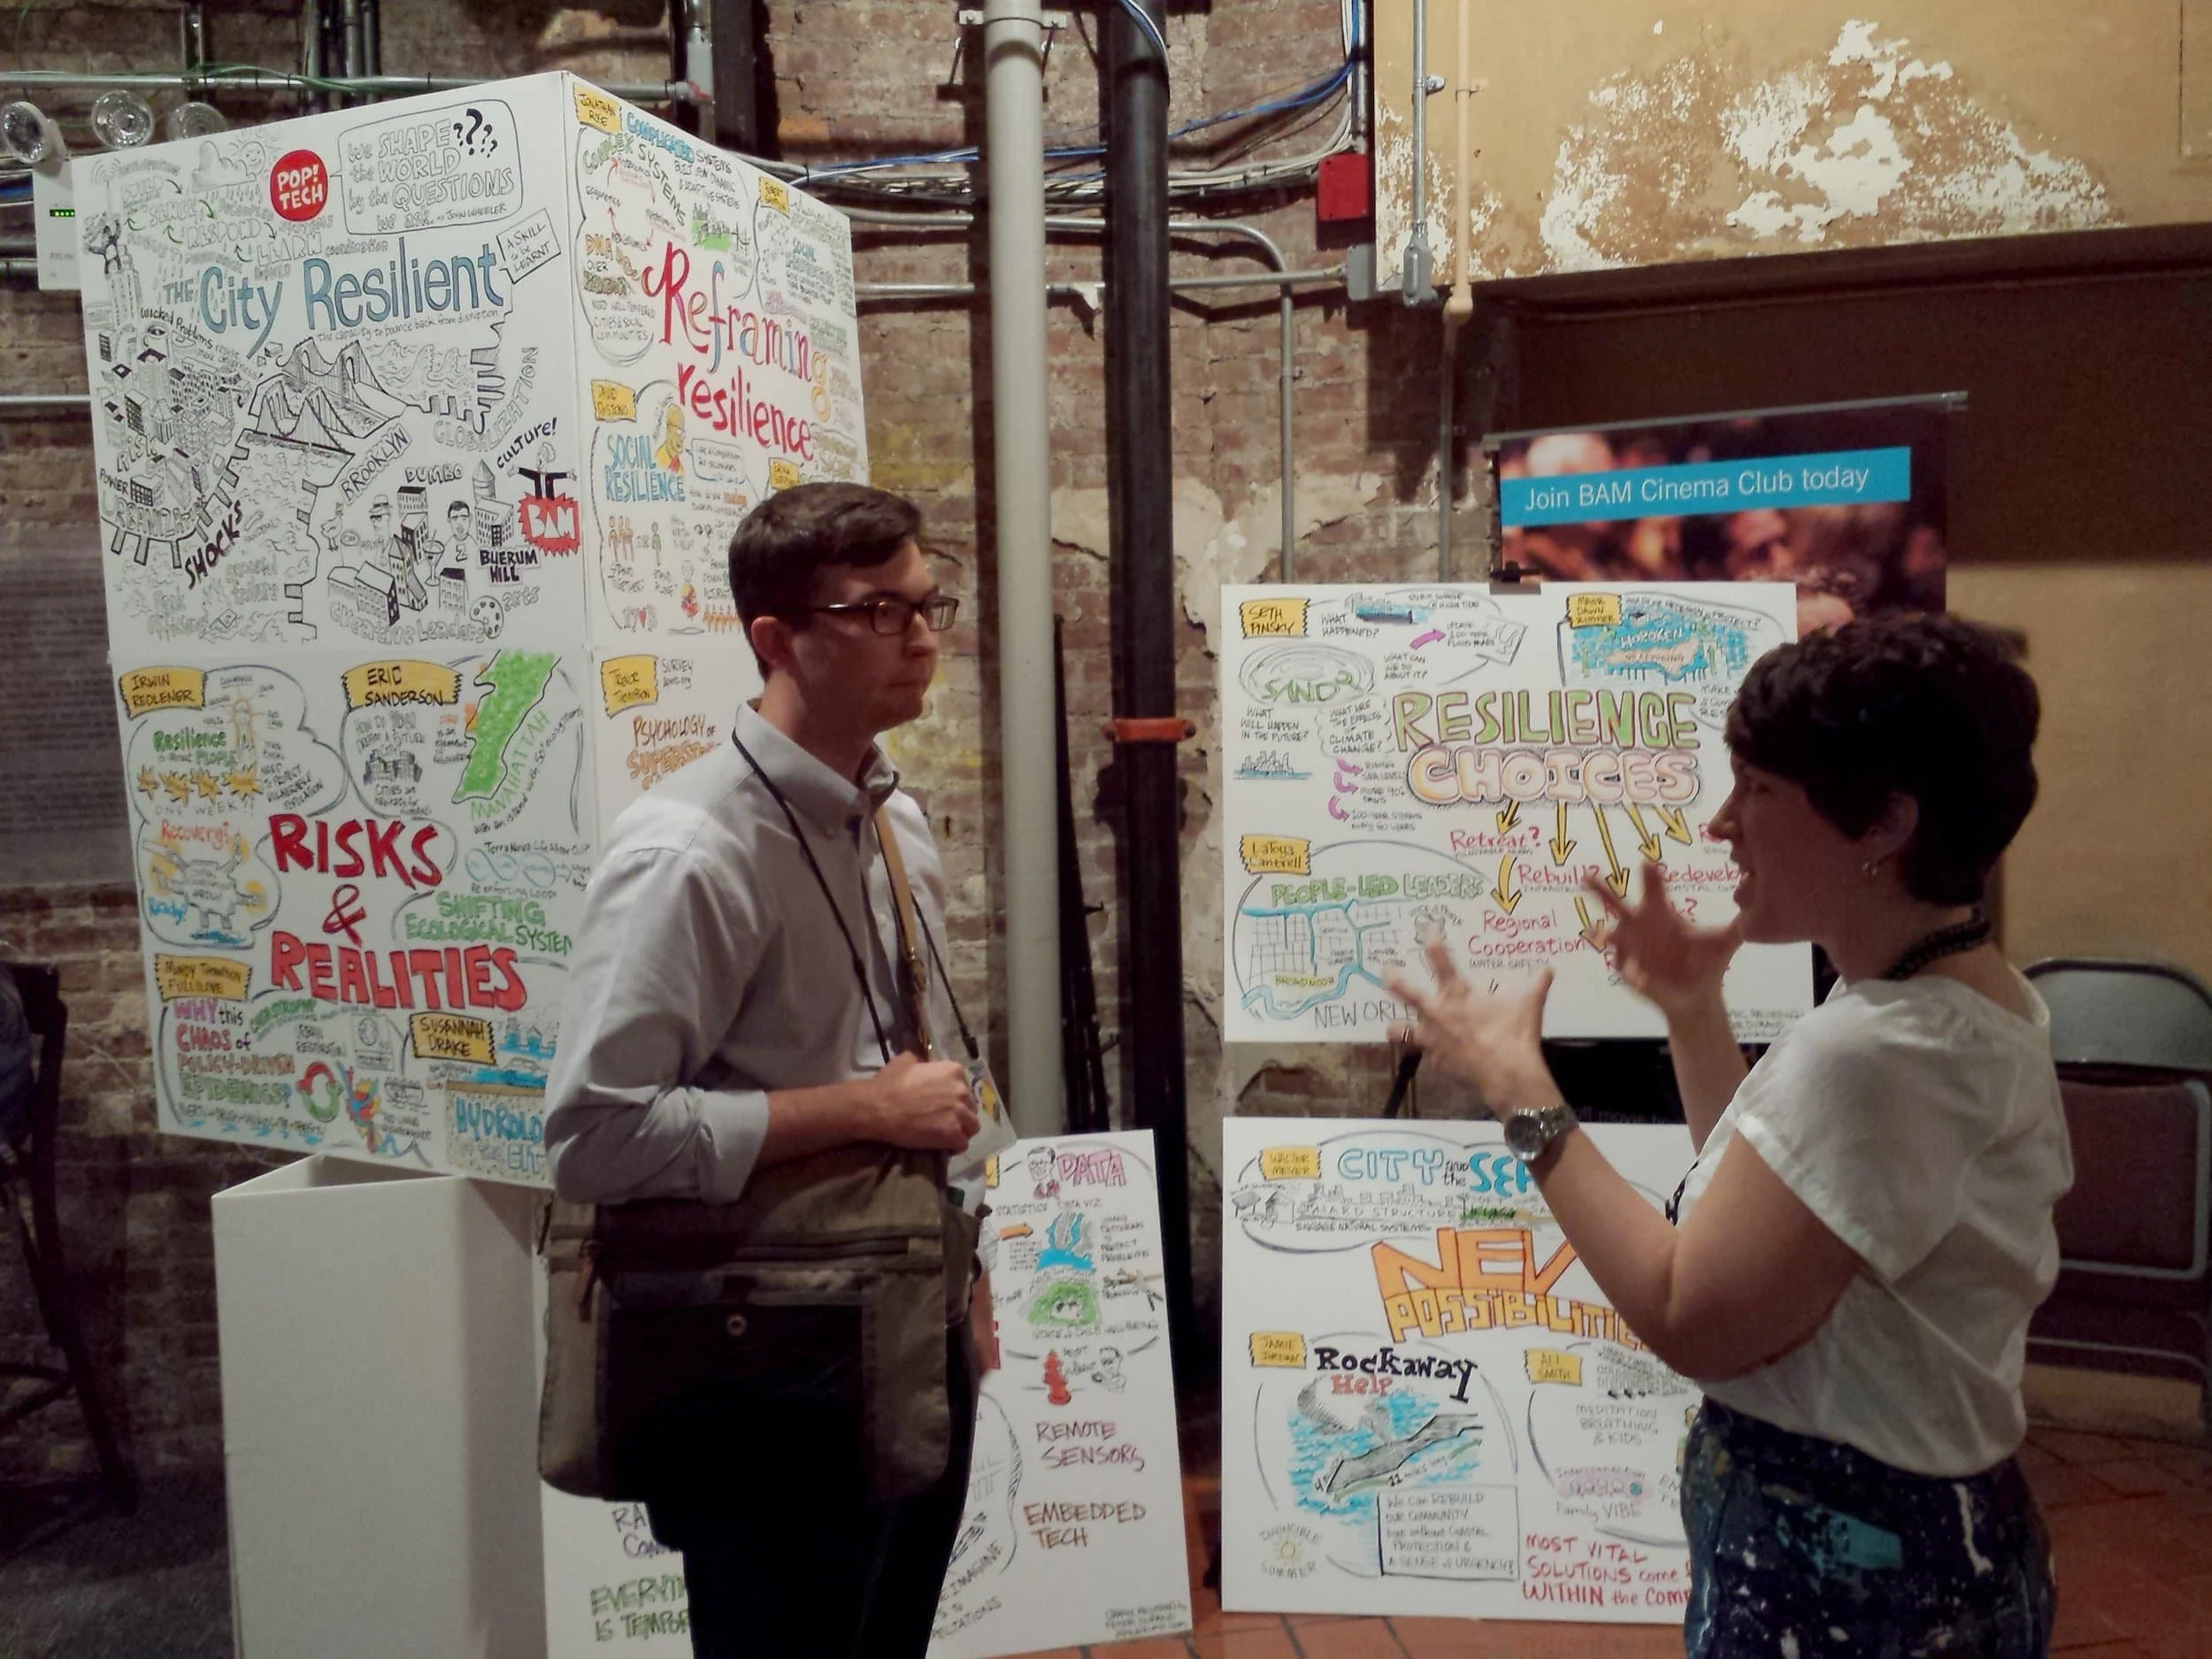
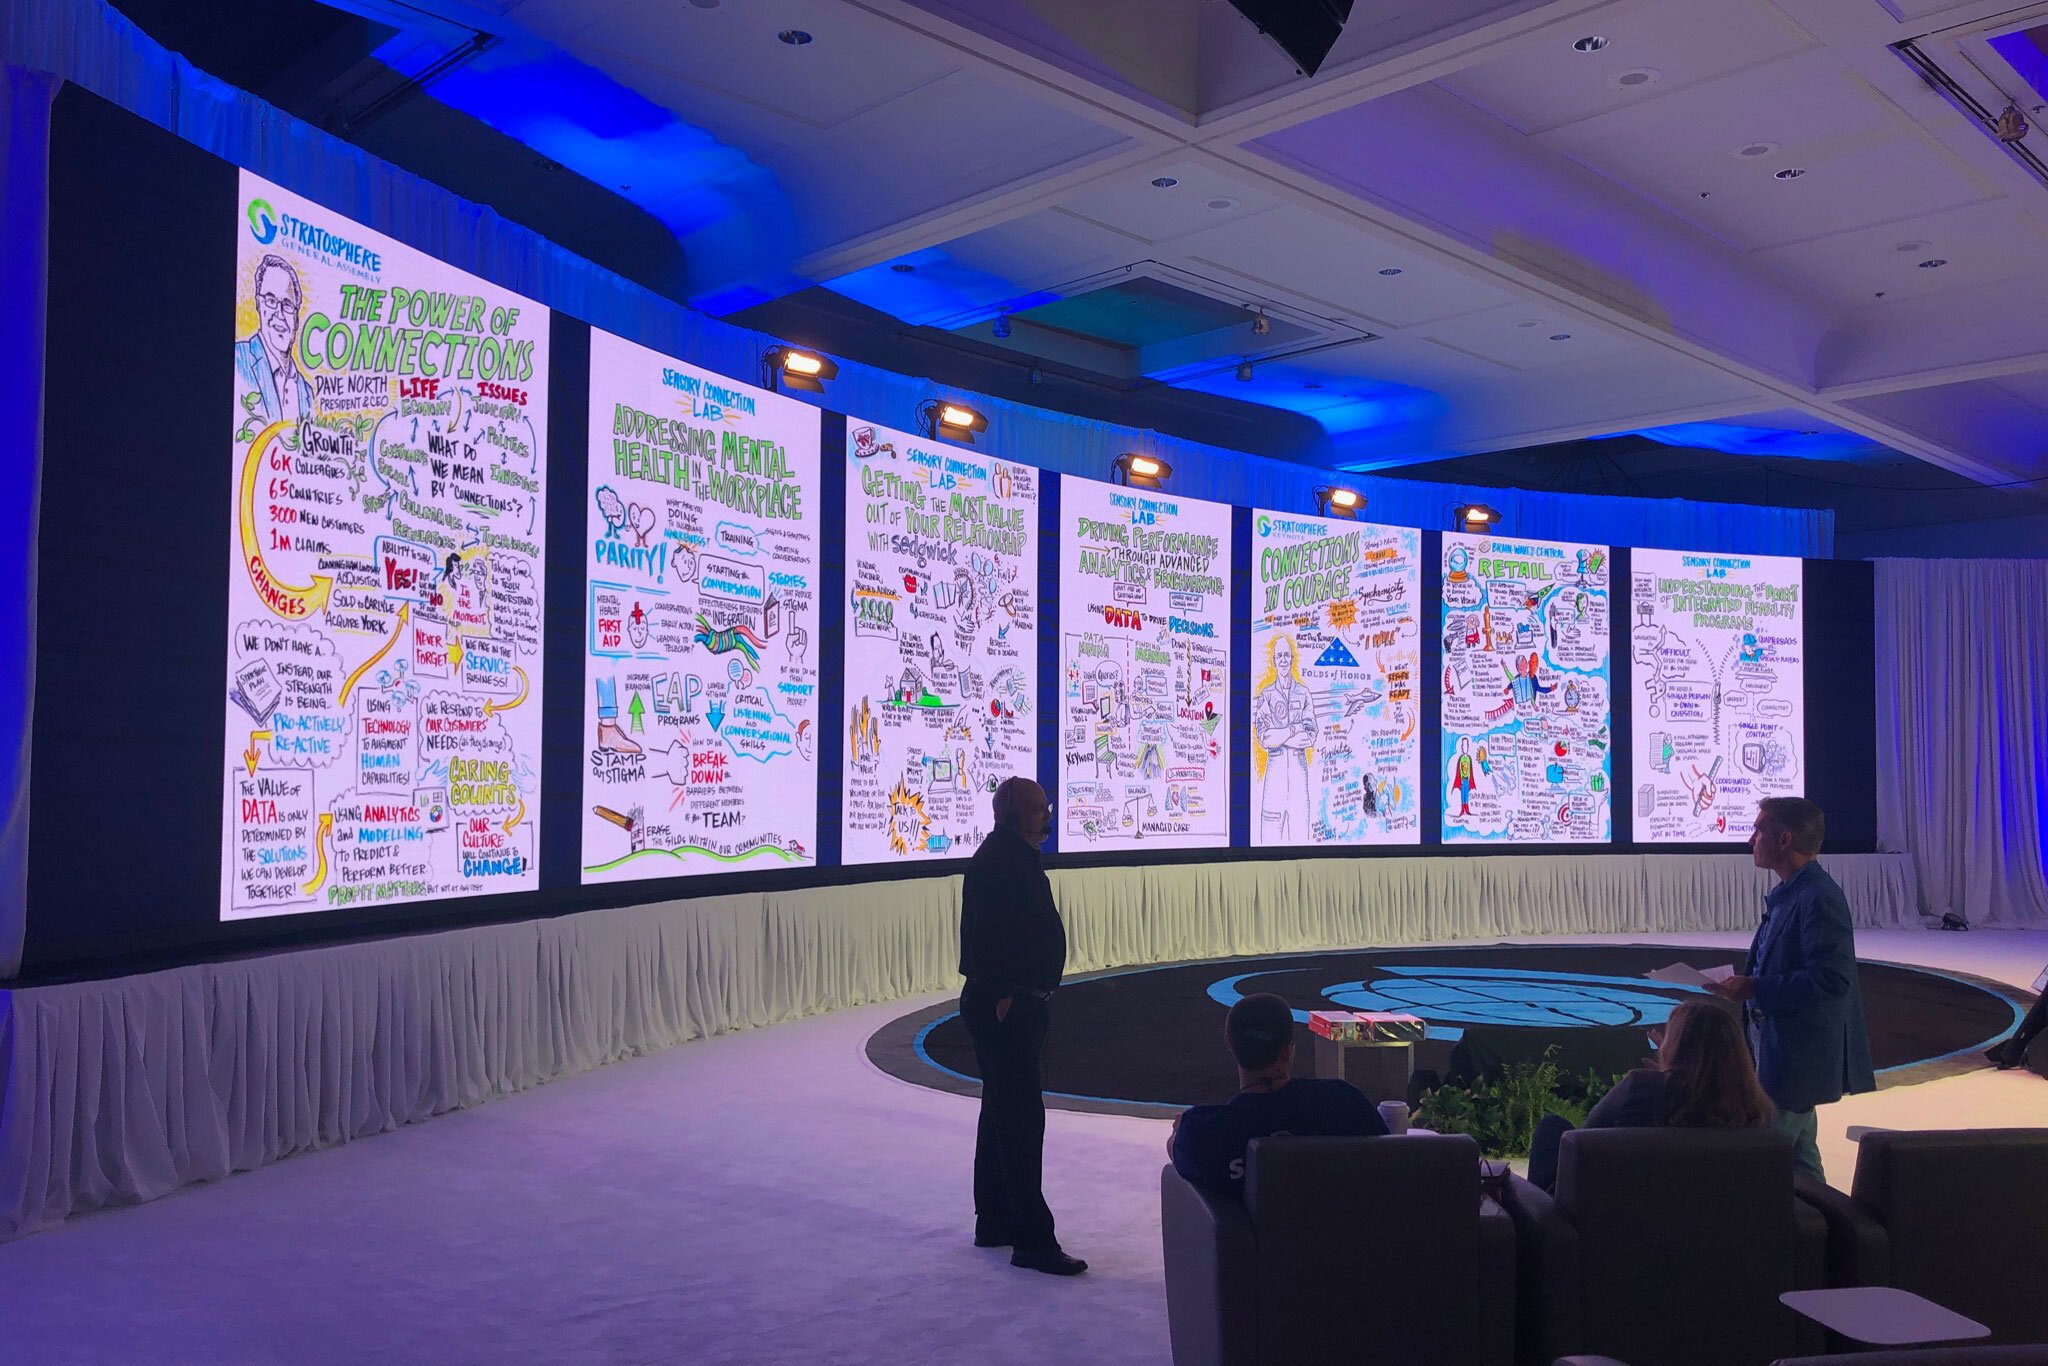
A Graphic Recorder captures conversations and presentations in real-time with large-scale visuals on large sheets of paper, foam-core boards, or whiteboards. Other terms include “Live Illustrator“ or “Live Scribe.“ (see examples.)
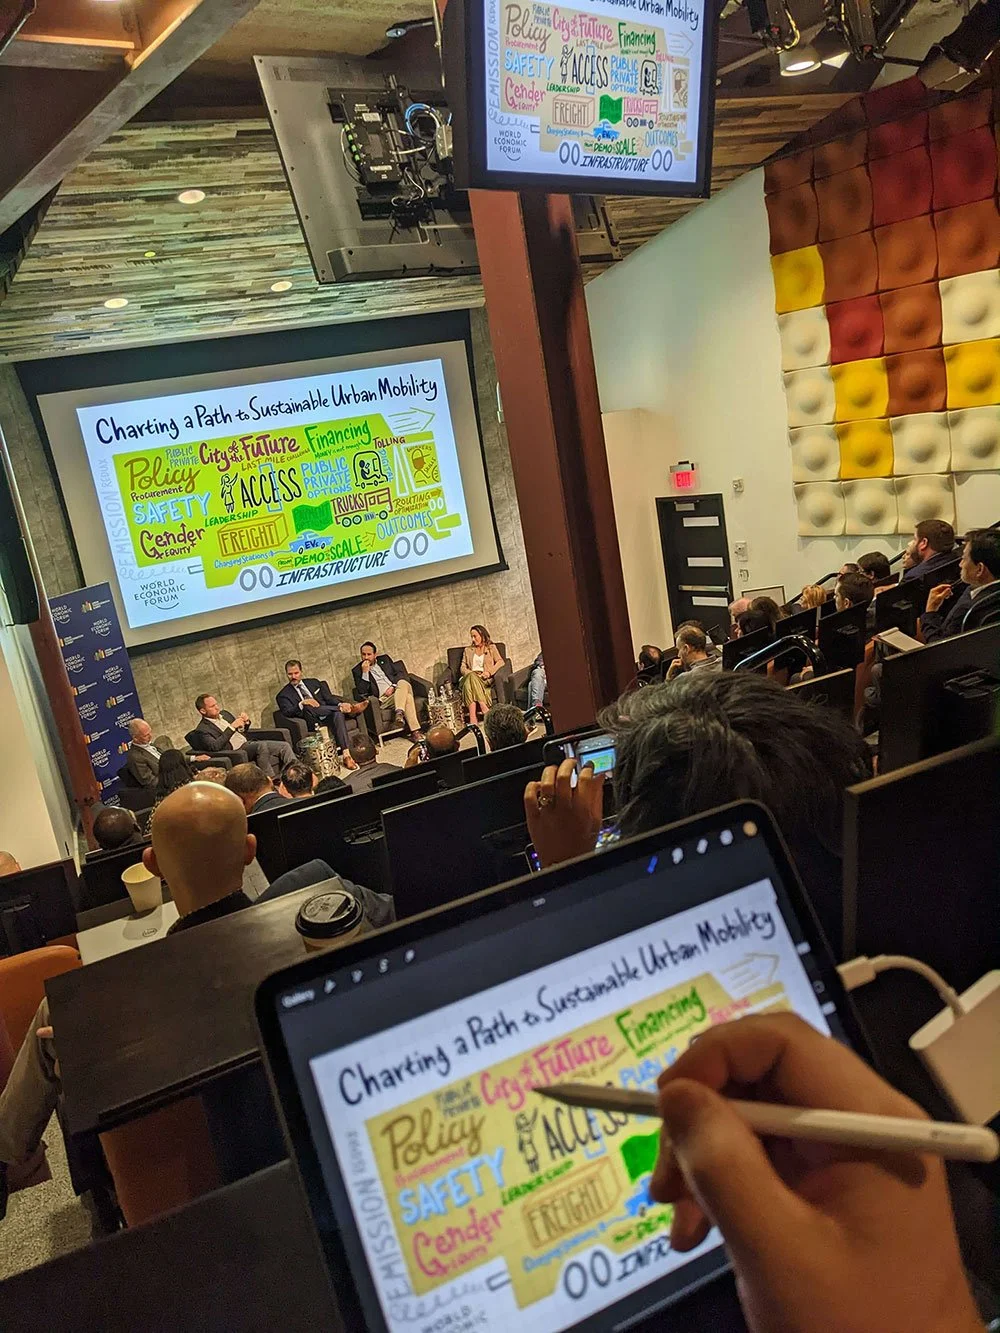
A Digital Graphic Recorder captures conversations and presentations using an electronic tablet and can livestream the images or present on monitors or projection screens. (see examples)
A Visual Facilitator takes it a step further by actively guiding group dialogue, using visuals to help teams brainstorm, align, and make informed decisions. (see examples)
A Visual Note-taker creates smaller-scale sketchnotes or summaries for individual or classroom learning. Although some practitioners also use this term for live scribing events. (see sketchnotes)
What makes Alphachimp different?
With over 25 years of experience, Alphachimp combines artistry, facilitation, and pedagogy.
Our founder, Peter Durand, has trained thousands of professionals worldwide and served as an adjunct professor at a prestigious American law school, blending creativity with academic rigor.
We are fortunate to have many talented peers and a global network of practitioners. However, we do not work with artists who have less than 10 years of experience.
Everyone on our team has extensive experience in listening to and working with professionals across various industries and domains, as well as deep studio experience and a background in the fine arts.